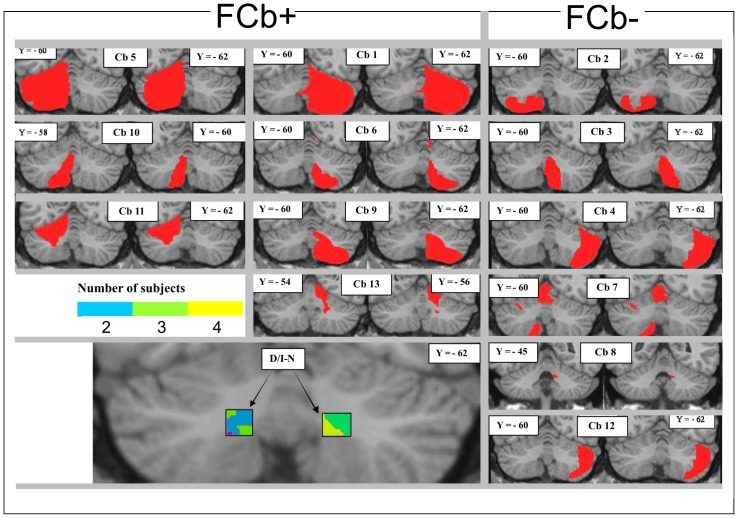
Figure 1. Lesion reconstruction in FCb+ and FCb− patients.
Each individual lesion is presented as an overlay of 2 representative coronal MRI T1-weighted templates in stereotaxic space after spatial normalization. The bottom left of the figure shows lesion overlap between patients and a reconstruction of the 3-D probabilistic map (51% to 60%) of right and left dentate/interposed (D/I-N) cerebellar nuclei. The color code indicates the number of subjects whose lesions overlapped with D/I-N nuclei.

