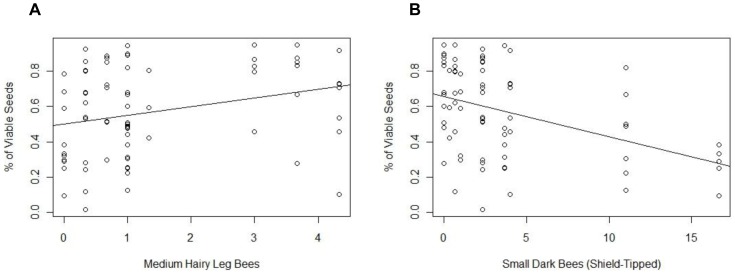
Figure 5. Correlation between the percentage of viable seeds in each yellow starthistle seed head and the average number of site visits by morphotype.
Bee morphotype visitation data, calculated community metrics, and yellow starthistle seed heads were collected in East Contra Costa County, California. Bee morphotypes that averaged at least one visit per 30 minute observation window were included as fixed effects in a linear mixed model fit with a binomial distribution, with site as a random effect and the ratio of viable to total seeds as the response variable. Medium hairy leg bees (effect size±SE = 0.284±0.069, p<0.001) and shield-tipped small dark bees (effect size±SE = −0.155±0.051, p = 0.002) had significant effect sizes in the model. Regression lines were added to illustrate relationships.

