
Figure 5.
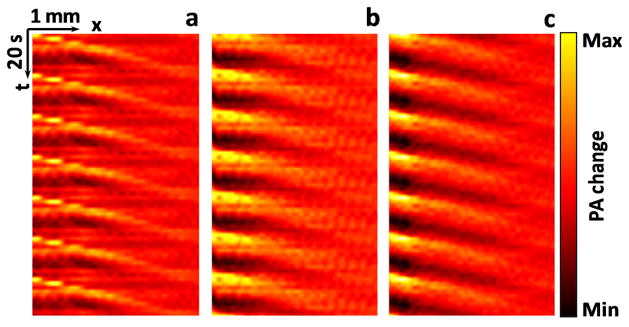
(Color online) Thermal trajectories imaged beneath chicken breast tissue. (a) Without tissue, average of 7 heating cycles. (b) 3-mm-thick tissue, average of 21 heating cycles. (c) 5-mm-thick tissue, average of 35 heating cycles. The flow speed was set to 1.4 mm·s−1. The measured flow speeds for (a)–(c) were 1.5±0.1 mm·s−1, 1.6±0.2 mm·s−1, and 1.5±0.2 mm·s−1 (mean ± standard error, N=8), respectively. PA: photoacoustic.