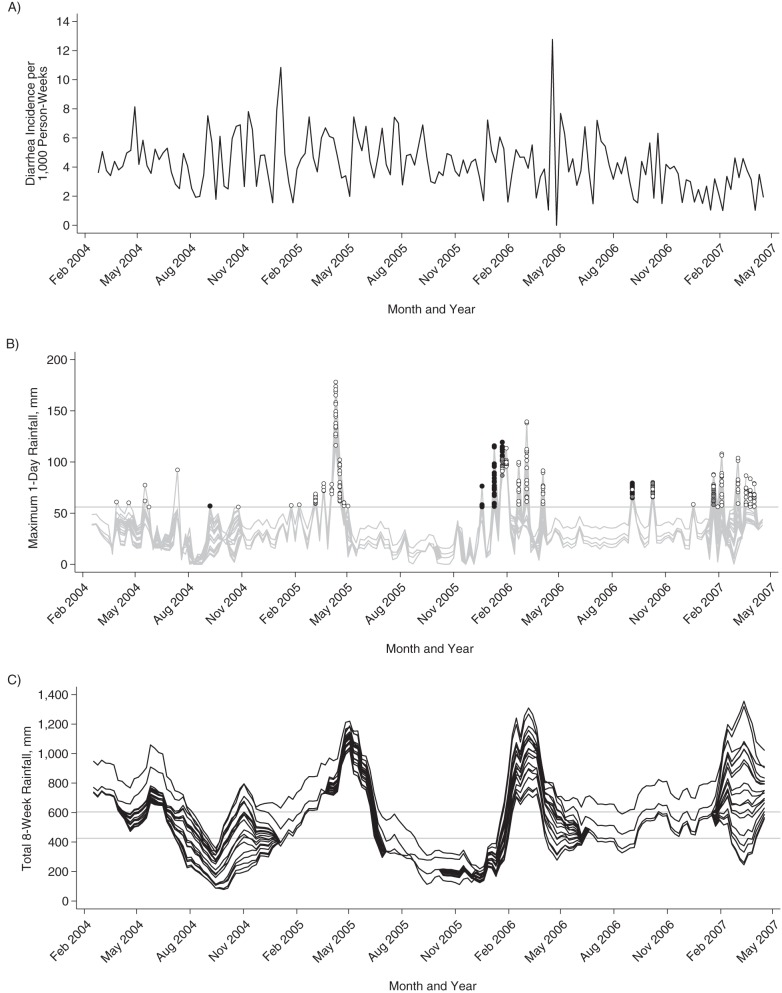
Figure 2.
Diarrhea incidence (A) and rainfall (B and C) in 19 study villages in a study of heavy rainfall events and diarrhea incidence, Ecuador, February 2004–April 2007. A) Weekly diarrhea incidence (cases per 1,000 person-weeks) across all villages. B) Maximum 24-hour rainfall in a 1-week period for each village. The graph shows heavy rainfall events occurring following periods of low (black dots), moderate (gray dots), and high (white dots) 8-week rainfall. The horizontal line shows the 90th percentile value (56 mm), used to define heavy rainfall events. C) Total rainfall in the previous 8 weeks for each village. Horizontal lines indicate the 33rd (426 mm) and 66th (605 mm) percentile values, used to delineate low, moderate, and high 8-week rainfall. Aug, August; Feb, February; Nov, November.

