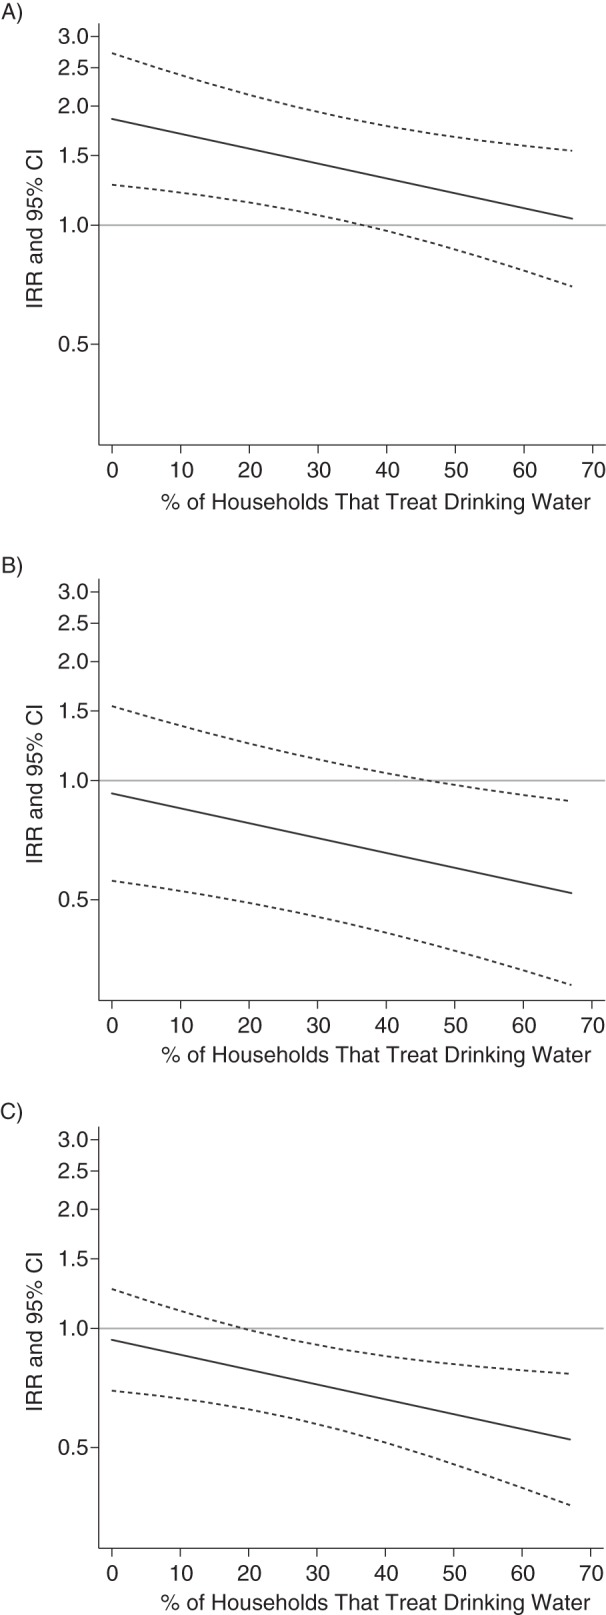
Figure 3.

Estimated association between heavy rainfall events and diarrhea incidence at different levels of community drinking-water treatment when rainfall during the previous 8 weeks was low (A), moderate (B), or high (C), Ecuador, 2004–2007. The incidence rate ratio (IRR; solid line) and 95% confidence interval (CI; dashed lines) are shown for the 10th through 90th percentiles of water treatment values observed in this study. Water treatment was defined as filtration, boiling, or chlorination of drinking water.
