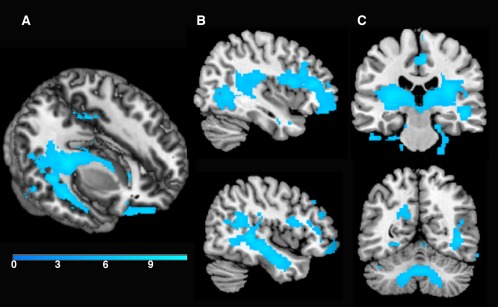
Figure 2.

Regions of tissue contraction for more than 4 years (P < 0.05, FWE corrected). As shown in the 3D render (A) and sagittal cross‐section (B), there was significant contraction in temporal stem white matter for more than 4 years. Additionally, as shown in the coronal sections (C), there was significant contraction in large portions of bilateral subcortical white matter and the cerebellum. The color bar represents T‐values.
