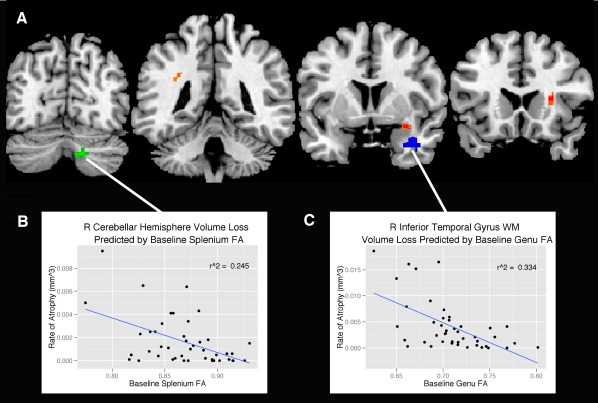
Figure 3.

Regions (A) where baseline FA from the splenium (green), entorhinal white matter (orange), and genu (blue) predict volume loss from baseline to follow‐up (P < 0.001, uncorrected). The statistical map is overlaid on coronal sections of the “CH2” template available in MRIcron (Rorden, 2007). The correlation between (B) baseline splenium FA and cerebellar hemisphere volume loss was r 2 = 0.25, P < 0.001 and (C) baseline genu FA and inferior temporal gyrus WM volume loss was r 2 = 0.33, P < 0.001. Data points represent individual participants. [Color figure can be viewed in the online issue, which is available at http://wileyonlinelibrary.com.]
