Fig. 5.
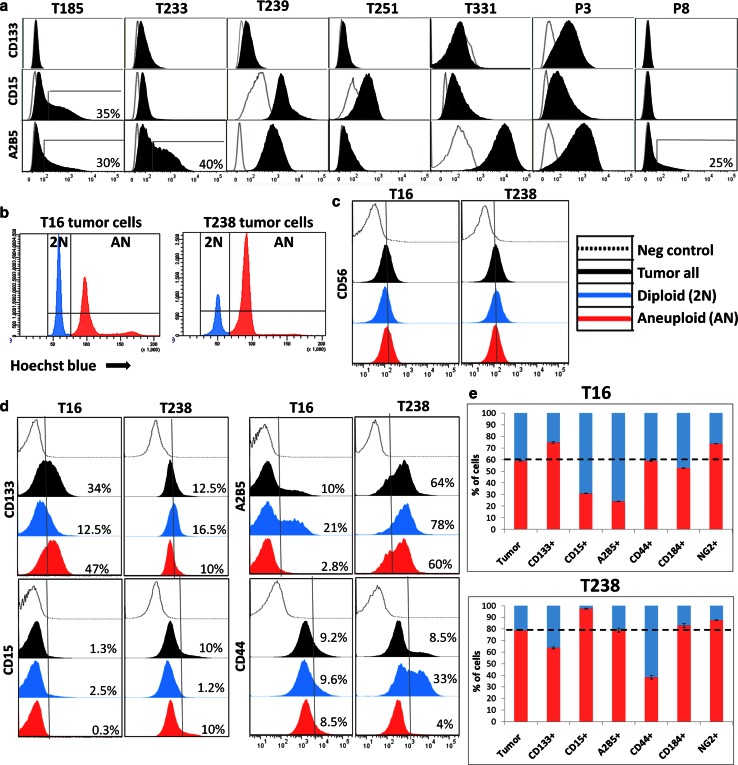
Genetically divergent clones display variable cancer stem cell-associated markers. a CSC-associated marker expression (CD133, CD15 and A2B5) as determined by flow cytometry in monogenomic GBM xenografts, showing a high variability between different GBMs. Expression (black) is displayed compared with negative controls (grey line). Intra-tumoural heterogeneity in some GBMs is presented as percentage of cells expressing high levels of CSC-associated markers. b Two polygenomic tumours (T16, T238) chosen for Hoechst-based ploidy profiling combined with cell membrane marker expression. c CD56 expression is similar in diploid and aneuploid clones of T16 and T238 GBMs. d Differential expression of CD133, CD15, A2B5 and CD44 in diploid and aneuploidy clones of T16 and T238 GBMs. Intra-tumoural heterogeneity is detected for all markers in the bulk tumour cells (‘black’). The discrimination between diploid (‘blue’) and aneuploid (‘red’) cells showed that marker expression varied between the two clones. The expression profiles and the percentage of positive/strongly positive cells for a given marker are displayed for each clone compared with negative controls (grey line). e The ratio of diploid versus aneuploid cells within a given marker-positive population is indicated, in comparison with the ratio detected in the bulk tumour cells (dotted line), indicating a high variability in marker expression between the genetically distinct clones. See supplementary Fig. 1b for the gating strategy

