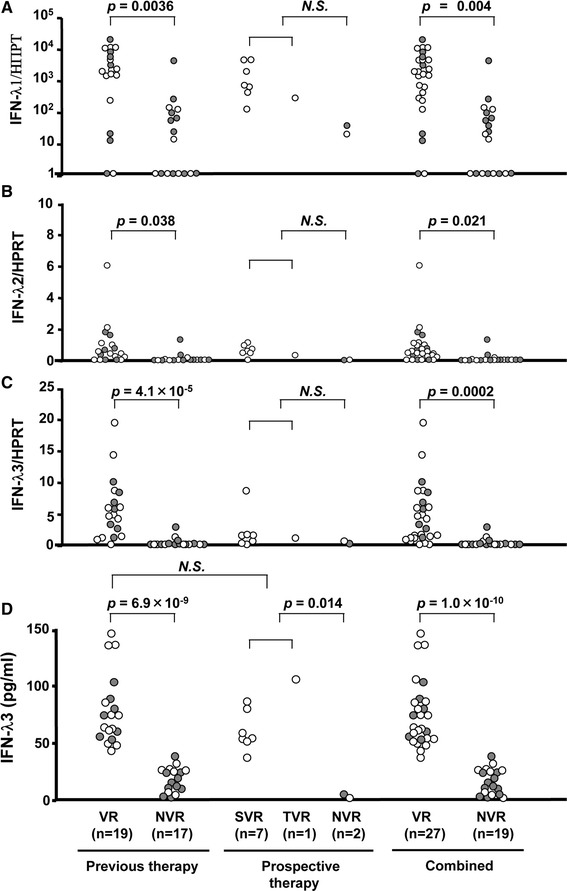
Fig. 5.

The mRNA and protein levels of IFN-λ3 ex vivo induced by R-837 and treatment responses in CHC patients with “the known response to Peg-IFN/RBV”. The mRNA levels of IFN-λ1 (a), IFN-λ2 (b), and IFN-λ3 (c) of virologic responders (VR) (n = 27) and non-virologic responders (NVR) (n = 19) were shown. (d) Protein levels of IFN-λ3 in CHC patients who had previously failed Peg-IFN/RBV therapy (previous therapy, n = 36) and who prospectively treated with Peg-IFN/RBV (prospective therapy, n = 10). Combined figures were also shown (n = 46). Each open circle represents TT genotype whereas each closed circle represents TG/GG genotype
