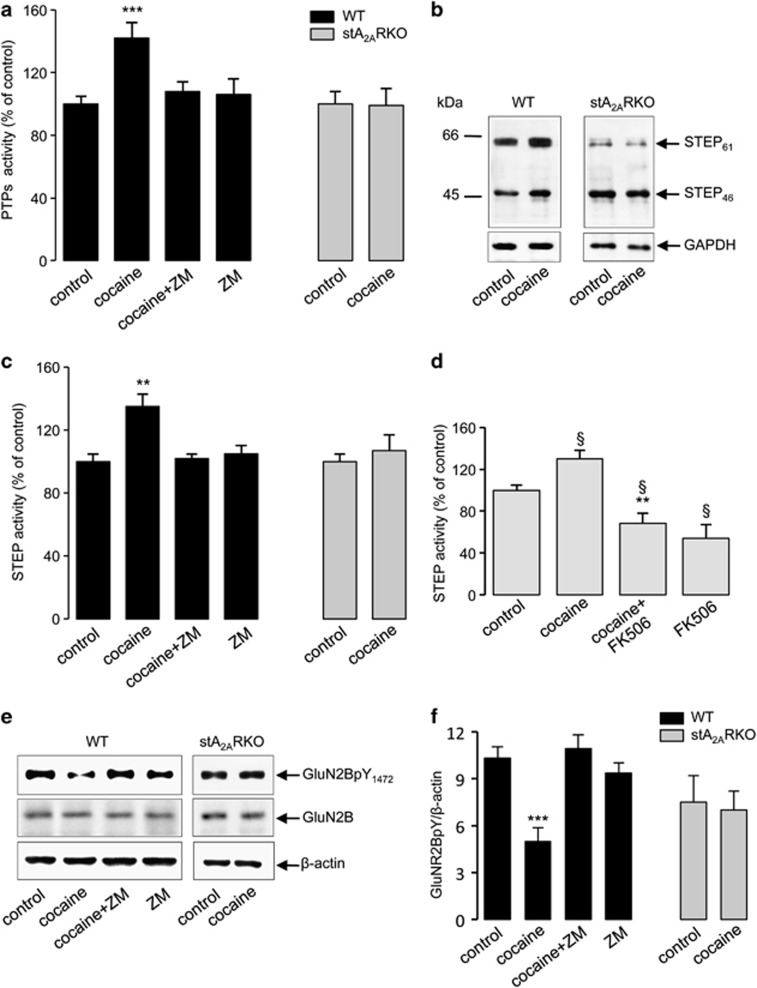
Figure 4.
The effect of cocaine on tyrosine phosphatase activity is mediated by A2ARs. (a) PTP activity was measured in synaptosomes obtained from WT (black columns, N=10) and stA2ARKO striatal slices (gray columns, N=4) treated with 10 μM cocaine for 10 min, with or without ZM241385. The activity is expressed as percentage of the control. The bar graph represents the means±SEM. ***significantly different from control (p<0.001, Kruskal–Wallis test). (b) Western blot analysis with an anti-STEP monoclonal antibody of synaptosomes from WT and stA2ARKO striatal slices treated with cocaine. The molecular mass markers in kDa are indicated on the left. The nitrocellulose was also probed with an anti-GAPDH antibody to evaluate the amount of loaded proteins (lower panels). The immunoreactive bands were detected by chemiluminescence coupled to peroxidase activity (ECL). The results shown are representative of three independent experiments. (c) Effect of cocaine on STEP activity. STEP was immunoprecipitated by a specific polyclonal antibody from solubilized synaptosomes prepared from WT (N=5) and stA2ARKO striatal slices (N=4) (black and gray columns, respectively) treated as described in (a). The phosphatase activity of STEP-immunocomplex is expressed as percentage of the value measured in control (100%). The bar graph represents the means±SEM. **significantly different from control (p<0.01, the Kruskal–Wallis test). (d) Effect of the calcineurin inhibitor FK506 on STEP phosphatase activity. Striatal slices (N=5) were incubated for 2-3 h with 1 μM FK506 and then treated with cocaine in the presence of FK506. STEP activity was measured in the immunocomplex obtained from solubilized synaptosomes. The bar graph represents the means±SEM (§p<0.05 vs control; **p<0.01 vs cocaine, the Kruskal–Wallis test). (e) Western blot analysis with anti-GluN2BpY1472 and anti-GluN2B antibodies of synaptosomes from WT and stA2ARKO striatal slices treated as described in (a). The nitrocellulose was also probed with an anti-β-actin antibody to evaluate the amount of loaded proteins (lower panels). The immunoreactive bands were detected by chemiluminescence coupled to peroxidase activity (ECL). (f) Quantification by densitometric analysis of GluN2BpY1472 band intensity relative to β-actin. The bar graph represents the means±SEM of 5 and 3 independent experiments for WT and stA2ARKO, respectively (***p<0.001 vs control, the Kruskal–Wallis test). ZM=ZM241385.

