Figure 5.
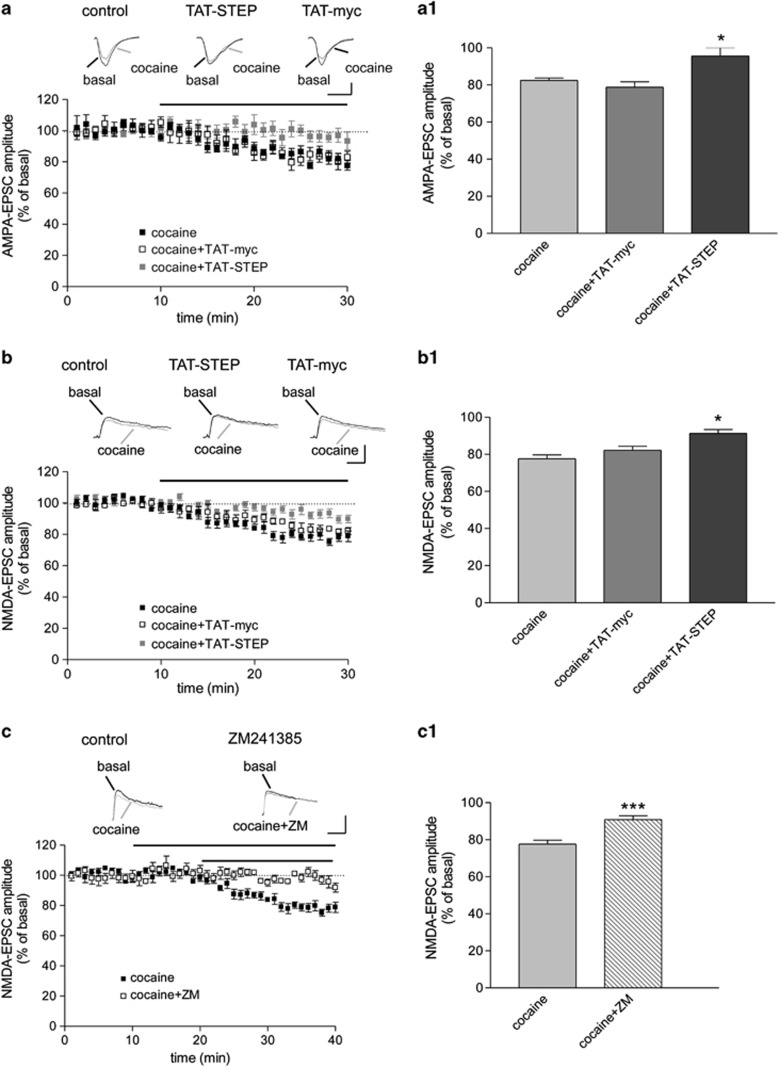
The effect of cocaine on excitatory synaptic transmission in MSNs is modulated by STEP and A2ARs. (a) A dosage of 10 μM cocaine reduced AMPA-EPSC (N=7); the effect of cocaine was reduced in the presence of the substrate trapping peptide TAT-STEP 100 nM in the recording pipette (N=10), while the addition of the control peptide TAT-myc (N=8) was ineffective. Each point represents the mean of three responses; insets show AMPA-EPSCs before and after cocaine application in control condition and in the presence of TAT-myc and TAT-STEP in the patch pipette. The horizontal bar indicates the period of cocaine application. Calibration bars: 50 ms, 50 pA. (a1) Bar graph shows the effect of cocaine on the amplitude of AMPA-EPSC 20 min after drug application (expressed as percentage of basal values). *p<0.05 vs cocaine and cocaine+TAT-myc, one-way ANOVA. (b) 10 μM cocaine reduced NMDA-EPSC (N=8); the effect of cocaine was significantly reduced by the addition of TAT-STEP in the recording pipette (N=15) but not by the control peptide TAT-myc (N=8). Each point represents the mean of three responses; insets show NMDA-EPSCs before and after cocaine application in control condition and in the presence of TAT-myc and TAT-STEP in the patch pipette. The horizontal bar indicates the period of cocaine application. Calibration bars: 100 ms, 100 pA. (b1) Bar graph shows the effect of cocaine on the amplitude of NMDA-EPSC 20 min after drug application (expressed as percentage of basal values). *p<0.05 vs cocaine and cocaine+TAT-myc, one-way ANOVA. (c) The effect of cocaine on NMDA-EPSC (N=8) is reduced by ZM241385 (100 nM) applied 10 min before and along with cocaine (N=8). Each point represents the mean of three responses; insets show NMDA-EPSCs before and after cocaine application in control condition and in the presence of ZM241385. The horizontal bars indicate the period of drugs application. Calibration bars: 100 ms, 100 pA. (c1) Bar graph shows the effect of cocaine, alone and in combination with ZM241385, on the amplitude of NMDA-EPSC 20 min after cocaine application (expressed as percentage of basal values). ***p<0.001, the Student t-test. ZM=ZM241385.

