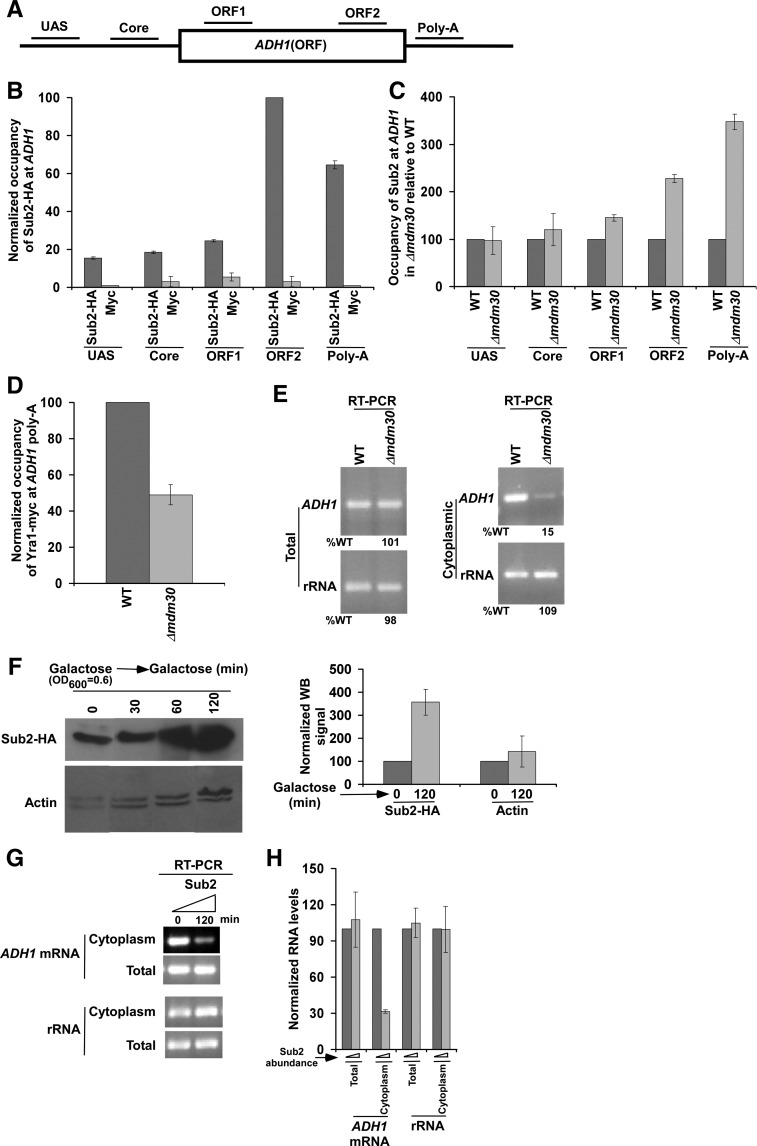
FIGURE 2.
Enhanced stability of Sub2 in the Δmdm30 strain reduces the recruitment of mRNA export adaptor to ADH1, and hence mRNA export. (A) A schematic diagram showing the locations of the primer pairs at ADH1 for the ChIP analysis. (B) Analysis of association of Sub2 with ADH1. Yeast strain expressing HA-tagged Sub2 was grown in YPD up to an OD600 of 1.0 at 30°C prior to formaldehyde-based in vivo crosslinking. Immunoprecipitation was performed as described previously (Bhaumik and Green 2002, 2003; Bhaumik et al. 2004; Shukla et al. 2006), using an anti-HA antibody (F-7; Santa Cruz Biotechnology, Inc.) against HA-tagged Sub2 or anti-myc (9E10; Santa Cruz Biotechnology, Inc.) as a control. Immunoprecipitated DNA was analyzed by PCR using the primer pairs located at different locations of ADH1 as schematically shown in A. The ratio of the immunoprecipitate over the input in the autoradiogram (termed as a ChIP signal) was measured. The maximum ChIP signal was set to 100, and other ChIP signals were normalized with respect to 100. The normalized ChIP signals (represented as normalized or relative occupancy) were plotted in the form of a histogram. Error bars denote standard deviations. (C) Analysis of Sub2 association with ADH1 in the presence and absence of Mdm30. Yeast cells were grown, crosslinked, and immunoprecipitated as in B. The ChIP signal of the wild-type strain was set to 100, and the signal from the mutant strain was normalized with respect to 100 at different locations of ADH1. (D) Analysis of Yra1 association with the poly(A) site of ADH1 in the presence and absence of Mdm30. Both the Δmdm30 and wild-type strains expressing myc-tagged Yra1 were grown, crosslinked, and immunoprecipitated as in B. (E) Analysis of total and cytoplasmic ADH1 mRNAs in the Δmdm30 and wild-type strains by RT-PCR assay. Yeast strains were grown as in B. The level of rRNA (18S rRNA) was analyzed as a loading control. (F) Sub2 expression analysis under the control of GAL1 promoter in galactose-containing growth medium (or YPG) by Western blot assay. Yeast cells were initially grown at 30°C up to an OD600 of 0.6, and then were collected at different time points (0, 30, 60, and 120 min). Western blot signal of Sub2 at 0 min was set to 100. Western blot signal of Sub2 at 120 min in galactose was normalized with respect to 100. Likewise, actin levels were normalized. Normalized Western blot signals were plotted in the form of a histogram. Error bar denotes standard deviation from three biologically independent experiments. (G) Analysis of total and cytoplasmic ADH1 mRNAs in the presence of a high level/abundance of Sub2 by RT-PCR assay. (H) The results of G were plotted in the form of a histogram. The PCR signal at 0 min was set to 100, and the signal at 120 min was normalized with respect to 100.

