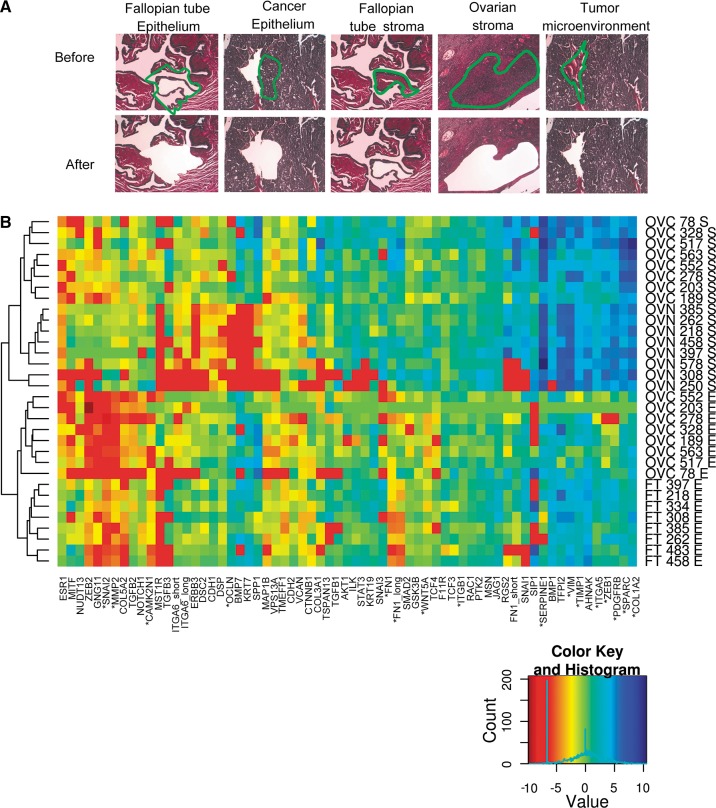
FIGURE 1.
Laser capture microdissection (LCM) of normal and cancer ovarian tissues. (A) Hematoxylin and eosin stain samples from Fallopian tubes, ovaries, and high-grade serous ovarian tumors visualized by light microscopy before and after dissection at 10× magnification. (Green) The limits of dissected tissues; (top) the type of tissues examined. Dissected tissues with similar cell population in both normal and cancer samples were chosen for RNA extraction. Typically, dissected Fallopian tube epithelium was composed of 90% epithelial and 10% fibroblast cells; dissected cancer epithelium was composed of >95% epithelial and <5% fibroblast and other nonepithelial cells (e.g., endothelial and inflammatory cells); dissected ovarian stroma and dissected tumor microenvironment were composed of 60%–80% fibroblast, 10%–20% endothelial, and 10%–20% inflammatory cells (for details, see Materials and Methods). (B) Quality of the dissected tissues. The expression of 65 stromal and epithelial markers was monitored in eight high-grade serous ovarian cancer, eight Fallopian tube epithelia, and eight normal ovarian stroma dissected samples. Relative values were normalized to housekeeping genes as previously described (Prinos et al. 2011). The results are displayed in the form of a heatmap representing the log-transformed gene expression value of epithelial and stromal markers (x-axis) in the different tissues (y-axis). Tissue samples were classified using unsupervised clustering of log-transformed gene expression values using Manhattan distance. (Left) The clustering dendrograms; (right) the type of tissues; (bottom right) the color code representing the gene expression. (Red) Low expression; (blue) high expression. (*) The most predictive markers (P < 0.0001, t-test). Detailed description (Supplemental Table S13) and individual expression values (Supplemental Table S1) of the dissected tissues are provided as Supplemental Material.

