
FIGURE 2.
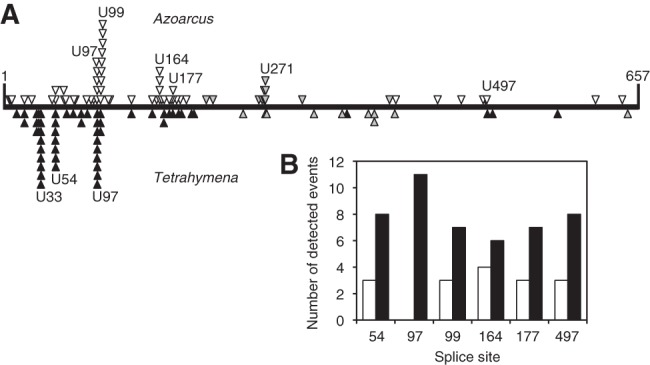
Experimental comparison of favored splice sites and trans-splicing efficiencies between Tetrahymena and Azoarcus. (A) Patterns of splicing events along the sequence of CAT mRNA substrate (horizontal line) between positions 1 and 657. The events detected for the Azoarcus ribozyme (above the line; open triangles) are compared to the events recorded for the Tetrahymena ribozyme (below the line; closed triangles) (from Meluzzi et al. 2012). Open and closed triangles denote splicing events that were detected with RT-PCR primers covering the entire length of the CAT mRNA. Gray triangles denote splicing events that were detected with a nested 5′ PCR primer to identify splice sites at least 200 nt downstream from the 5′ terminus of the CAT mRNA. All identified splicing products are reported here, which includes 10 non-U splice sites for the Azoarcus ribozyme and seven non-U splice sites for the Tetrahymena ribozyme. The positions of all individual splice sites are listed in Supplemental Table S1. (B) Comparison of trans-splicing efficiencies of Azoarcus ribozymes (white columns) and Tetrahymena ribozymes (black columns) when targeted to six specific splice sites on CAT mRNA.