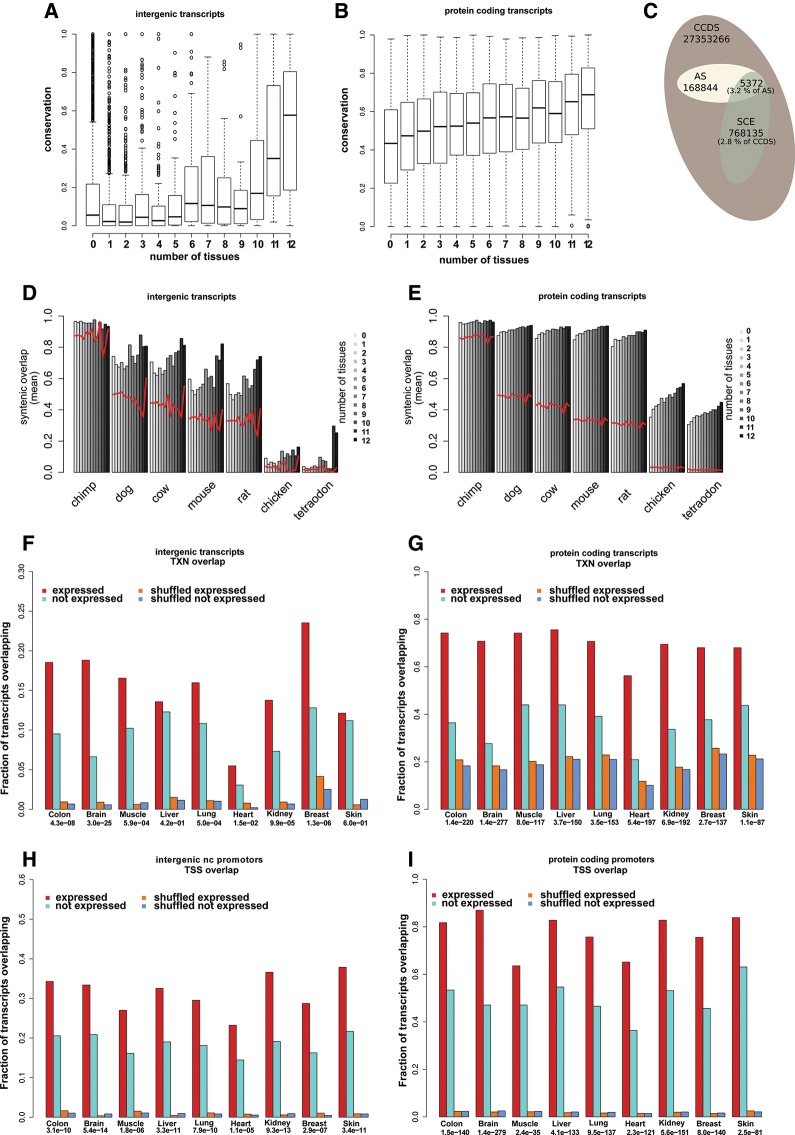
FIGURE 4.
Conservation of expressed noncoding RNA transcripts. (A,B) Box plots of transcript conservation for intergenic (A) and protein-coding transcripts (B). Each box represents transcripts expressed in the given number of tissues. (C) Distribution of bases overlapping synonomous constraint elements (SCE) among the background set of bases overlapping the human consensus coding sequences (CCDS). The fraction that overlaps with antisense (AS) ncRNAs is indicated. (D,E) Average overlap with chained alignments in seven species for intergenic (D) and protein-coding transcripts (E). Transcripts were stratified by tissue specificity of expression (gray scale). Red lines indicate similar overlap values for corresponding transcripts with shuffled genome coordinates. UCE and EvoFold predictions were omitted from this analysis (see text for details). (F–I) Gene body (F,G) and promoter (H,I) overlap with ChromHMM epigenetically derived functional elements. Fraction of transcripts overlapping regions with epigenetic marks associated with either transcription (TXN) or transcription start sites (TSS) are given for each tissue for both intergenic nc transcripts (F,H) and pc transcripts (G,I). The overlap is evaluated for both expressed (red) and nonexpressed (cyan) transcripts as well as shuffled control sets (orange and blue) (see Materials and Methods). Over-representation P-values (Fisher's exact test) for expression and overlap are given for each tissue.

