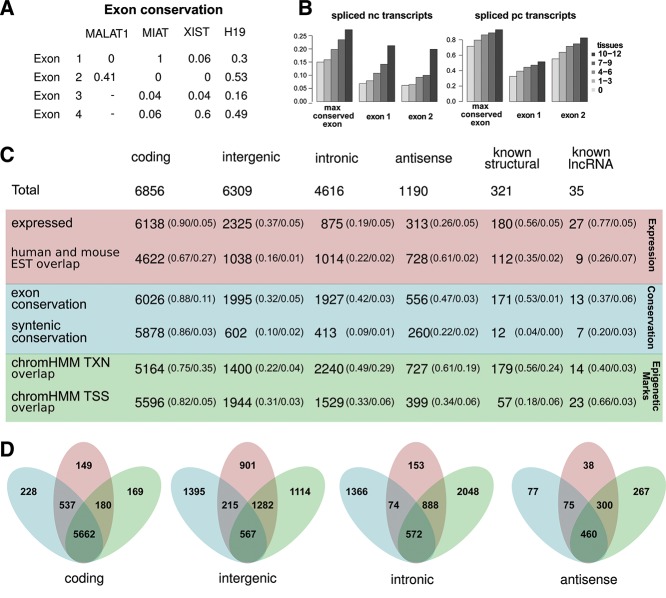
FIGURE 5.
Overview of transcript annotations and exon conservation. (A) Table of exon conservation of four known, functional lncRNAs. (B) Mean maximal exon conservation across all exons as well as mean conservation for exon number one, and two for nc transcripts (left) and pc transcripts (right) stratified by tissue specificity. (C) Table summarizing annotations statistics for pc transcripts, the three classes of nc transcripts and two known nc sets. The statistics are divided into three main types: expression (red), conservation (blue), and epigenetic marks (green). Numbers represent counts of transcripts overlapping a given annotation (ESTs and epigenetic marks) or fulfilling the criteria of max exon conservation >0.5 and syntenic P-value measure <0.01 (see text for details). Fraction of transcripts in a given category fulfilling the given annotation criteria is given in parenthesis, followed by FDR estimates either defined by the inference method (array expression) or by genomic shuffling (all other annotations). (D) Venn diagrams showing number of transcripts fulfilling at least one criteria within each of the three main types. Colored as in C.

