This work reports a new method for the detection of specific mRNAs using unlabeled oligonucleotides, thereby reducing cost and improving simplicity.
Keywords: RNA-FISH, mRNA localization
Abstract
The ability to detect RNA molecules in situ has long had important applications for molecular biological studies. Enzyme or dye-labeled antisense in vitro runoff transcripts and synthetic oligodeoxynucleotides (ODN) both have a proven track record of success, but each of these also has scientific and practical drawbacks and limitations to its use. We devised a means to use commercially synthesized oligonucleotides as RNA-FISH probes without further modification and show that such probes work well for detection of RNA in cultured cells. This approach can bind a high concentration of fluorescent ODN to a short stretch of an RNA using commercial DNA synthesis outlets available to any laboratory. We call this approach for creating in situ hybridization probes Fluorescence In Situ Hybridization with Sequential Tethered and Intertwined ODN Complexes (FISH-STICs). We demonstrate that one FISH-STIC probe can detect mRNA molecules in culture, and that probe detection can be improved by the addition of multiple probes that can be easily adapted for robust mRNA quantification. Using FISH-STICs, we demonstrate a nonoverlapping distribution for β-actin and γ-actin mRNA in cultured fibroblasts, and the detection of neuron-specific transcripts within cultured primary hippocampal neurons.
INTRODUCTION
In vitro–transcribed in situ hybridization (ISH) probes have long been applied in histology, and whole-mount gene expression pattern analysis, but they have found little application in the single-molecule RNA detection desirable in studies of mRNA localization (Qian and Lloyd 2003; Itzkovitz and van Oudenaarden 2011). For that purpose, multiply labeled fluorescent oligodeoxynucleotides (ODN) probes can image single mRNAs (RNA-fluorescence in situ hybridization, RNA-FISH) (Femino et al. 2003; Grunwald et al. 2008). Synthesis of these FISH probes requires in-house DNA synthesis to accommodate the multiple modified nucleotides for coupling, and post-synthesis dye coupling can be inefficient and difficult to control. Unlabeled probes compete with labeled probes, in this case making well-labeled probes a must for the success of the technique. A desirable feature of these probes is that they can bind up to five dye molecules to stretches of mRNA 45–50 nucleotides (nt) in length, making them amenable to detecting small patches of RNA under the careful imaging conditions required to detect such probes. As a practical matter, the expense and difficulty involved make these inaccessible to most laboratories. A cocktail of consecutive 20-mer antisense ODN probes each coupled with a single dye molecule at the 5′ end increases the accessibility and mRNA detectability when larger stretches of an RNA are available to image (Raj et al. 2008). In-house coupling of dye to commercially purchased modified oligonucleotides is still difficult to control, and large amounts of modified nucleotides and dyes for coupling still make the technique more expensive and involved than most laboratories would undertake on their own. Stellaris RNA FISH (Biosearch Technologies) offers such probes commercially for researchers who do not have the capacity to create these probes on their own. QuantiGene probes from Panomics (Affymetrix Inc.) detect single mRNA molecules with sequential ODN probes that use branched DNA to amplify signals (Collins et al. 1997; Player et al. 2001). This probe synthesis approach is proprietary and cannot be re-created in-house to reduce the cost. Other methods to make FISH more accessible to laboratories unable to rationalize the expense of the commercial offerings are desirable.
We devised a strategy for creating ODN in situ hybridization probes we call Fluorescence In Situ Hybridization with Sequential Tethered and Intertwined ODN Complexes (FISH-STICs). This method for FISH probe design offers laboratories an ability to detect mRNAs that does not require an in-house DNA synthesizer for custom modifications that ODN supply companies do not offer, or offer only at great expense. This approach uses entirely commercially purchased synthetic ODNs that can be used without any modification or processing. It increases the fluorescence output of small stretches of RNA that can be recognized by multiply labeled ODNs, making such small stretches of nucleic acid more easily detectable. We demonstrate the application of FISH-STICs using β-actin and γ-actin mRNA, showing that these two mRNAs encoding highly similar proteins have demonstrably different distributions within cells in culture. We think that FISH-STICs offers an RNA-FISH probe synthesis approach that is accessible to laboratories wanting to use it who might otherwise be discouraged by the financial, practical, or scientific disadvantages of the other avenues for RNA-FISH.
RESULTS
Our FISH-STICs design starts with one primary ODN directed against 50 unique nucleotides of an mRNA of interest and a secondary ODN that hybridizes to a trimerized unique 35-nt tag sequence tethered to the end of the 50-nt antisense primary ODN (Fig. 1). A tertiary ODN hybridizes to this secondary ODN through a different pentamerized unique 25-nt tag sequence at the end of the secondary ODN (Fig. 1). The tertiary ODN is directly coupled to a fluorescent dye, allowing detection of the RNA that the dye is bound to through the intertwined ODN complexes (Fig. 1). In practice, it works like classical immunofluorescence with successive ODNs replacing antibodies. The three successive hybridizations using decreasing lengths of oligonucleotide complementarity were chosen so as to facilitate decreasing stringency for each step. In this way, later steps are carried out under conditions that prevent dissociation of previously hybridized ODNs.
FIGURE 1.
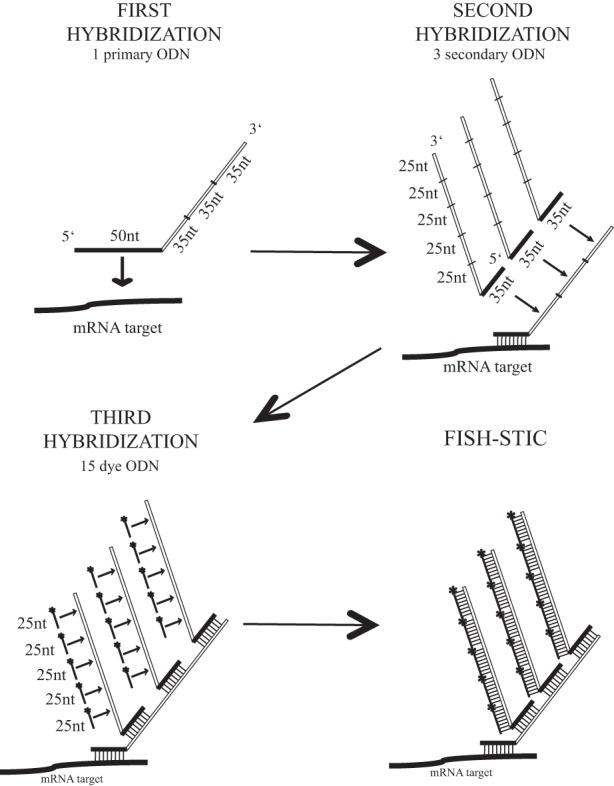
FISH-STICs probe diagram. In the first hybridization, the 50 nt at the 5′ end of the primary ODN is complementary to the RNA target (mRNA, ncRNA). Three repeats of a unique 35-nt sequence are added at the 3′ end of the primary ODN. In the second hybridization, the 35 nt at the 5′ end of the secondary ODN is complementary to the 35-nt sequence of the primary ODN. Five repeats of a distinct unique 25-nt sequence are added at the 3′ end of the secondary ODN. In the third hybridization, the tertiary/dye ODN is complementary to the 25 nt of the secondary ODN and synthesized with a fluorescent dye, or any other means of detection, coupled to the 5′ end. Through these three sequential hybridizations the individual ODN complexes can include as many as 15 tertiary ODNs, giving a bright signal for epifluorescence imaging. Multiple primary ODNs against the same mRNA can incorporate common secondary and tertiary tag sequences, to increase brightness of the probes. Note that the ODNs shown are not drawn to scale.
Cytoskeleton protein–encoding mRNAs were initially observed to have a cytoplasmic distribution that did not overlap total polyadenylated RNA (Lawrence and Singer 1986). The β-actin (Actb) mRNA has become a paradigm for an actively localized mRNA in cells, and its distribution in cultured cells and primary neurons is governed by inadequately defined machinery that regulates the β-actin protein synthesis spatially and temporally (Huttelmaier et al. 2005; Rodriguez et al. 2006). The γ-actin (Actg) mRNA produces an almost identical protein, and independent studies showed that the γ-actin mRNA shows a different subcellular localization in cultured myoblasts and in cultured neurons that is different from the Actb mRNA (Hill and Gunning 1993; Bassell et al. 1998). This suggests that the Actg mRNA is likely regulated by different machinery from Actb mRNA, but this regulation is not at all understood. We designed a FISH-STICs probe to single 50-mer sequences within mouse Actb mRNA and hybridized these to immortalized MEFs on coverslips. These probes labeled small fluorescent puncta in a primary, and secondary ODN-dependent manner, demonstrating that fluorescence detection requires assembly of complete complexes and that individual probes are sufficient to detect mRNAs in cultured cells (Fig. 2, cf. 2A to 2B–D). We found the potential for STIC probes to occasionally form mRNA-independent probe complexes that appeared brighter than individual mRNAs (Fig. 2A, arrowheads). These complexes did not form preferably over cells or bare coverslips (Fig. 2), and Cy3 and Cy5 complexes did not colocalize in subsequent two-color hybridizations (Figs. 3–6, below). The appearance of these complexes was variable, and their presence and intensity diminished with more robust agitation during washing, while the hybridization of probes to mRNA in cells was not affected.
FIGURE 2.
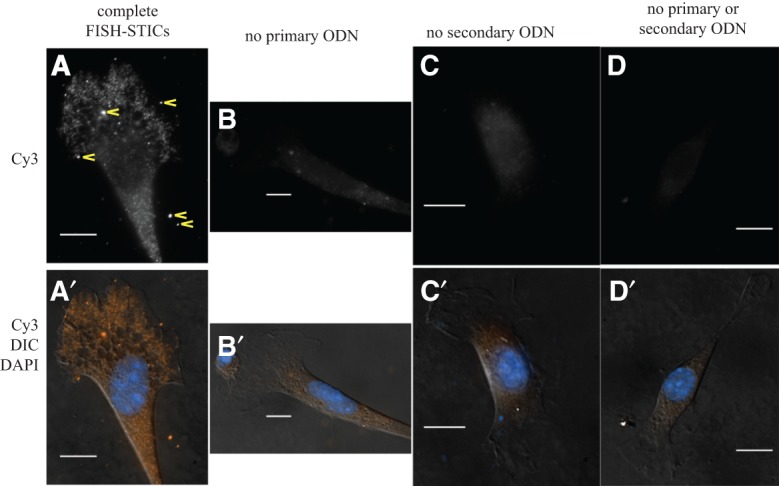
Detection of Actb mRNA with a single FISH-STIC probe. An Actb primary probe was hybridized to primary MEFs in parallel with control hybridization reactions omitting individual components of the probes. (Top row) Normalized Cy3 images of cells after hybridization with complete FISH probes (A) or probes lacking one component as indicated above (B–D). mRNA target-independent STIC complexes seen as much brighter puncta are indicated in A by yellow arrowheads. (A′–D′) Cy3 (orange), DAPI (blue), and DIC (gray) merged images of cells from A–D, respectively. Scale bars, 10 μm.
FIGURE 3.
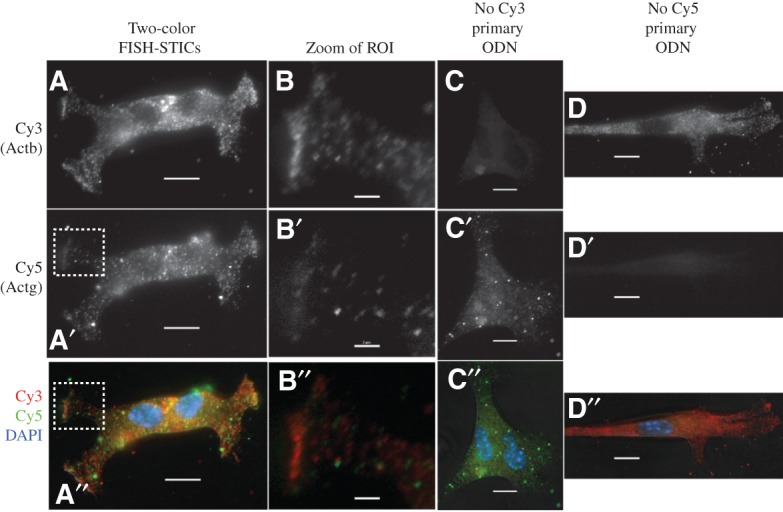
Simultaneous detection of Actb and Actg mRNAs with FISH STIC probes. Two Actb and two Actg primary probes were synthesized, and corresponding secondary and tertiary probes were synthesized to label Actb mRNA with Cy3 and Actg mRNA with Cy5. Probes were hybridized to primary MEFs and imaged with epifluorescence microscope. (Top row) Normalized Cy3 images of cells after hybridization with complete FISH probes (A,B) or probes omitting one set of primaries as indicated above (C,D). (Middle row) Normalized Cy5 images of cells after hybridization with complete FISH probes (A′,B′) or probes omitting one set of primaries as indicated above (C′,D′). (Bottom row) Cy3 (red), Cy5 (green), and DAPI (blue) merged images of cells above it. (B,B′,B′′) Detailed images of the boxed regions of interest (ROI) in panels A, A′, and A′′, respectively. Scale bars, (columns A,C,D) 10 μm; (column B) 2 μm.
FIGURE 6.
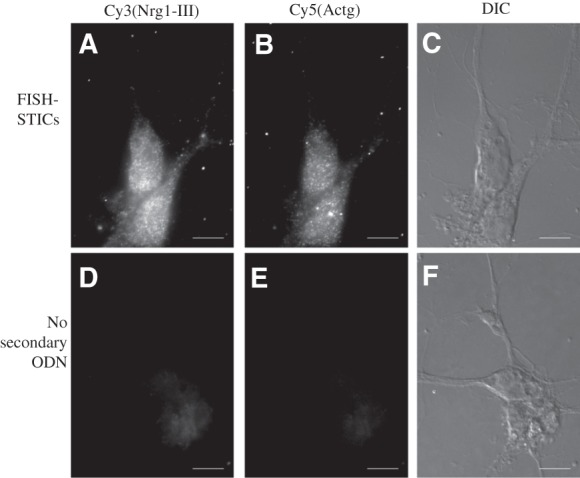
FISH-STICs detection of Nrg1-III and Actg mRNA in primary neurons. Embryonic day 18 (E18) cortical neurons were plated on poly-lysine-coated coverslips and maintained in culture for 10 d in vitro (DIV). 5-Fluoro-deoxy-uridine (FDU) was added after 3 DIV. Neurons were fixed and then cohybridized with Cy3 Nrg1-III (A), Cy5 Actg (B) primary probes and corresponding secondary probes. (D,E) Normalized images from control hybridization reactions lacking any secondary probe. DIC images of the cells imaged in Cy3 and Cy5 are shown in panels C and F of the hybridizations indicated. Images are single-plane epifluorescence taken at 60× magnification. Scale bar, 10 μm.
Single probes could detect mRNA as expected, but a stronger fluorescence signal is preferable for quantitative image analysis, so we created a second primary Actb probe that would bind to the same secondary and Cy3 dye ODN we used above. We also designed two primary probes for Actg mRNA that bind to a distinct secondary ODN and a Cy5 dye ODN for this secondary. Actb probes and Actg probes were cohybridized to MEFs, and Cy3 and Cy5 mRNA puncta were spatially separable, consistent with these probes hybridizing to distinct mRNAs (Fig. 3, cf. red and green overlap in panels A′′ and B′′). Different numbers of Cy3 and Cy5 puncta are also apparent in the images, consistent with more Actb mRNA in these cells than Actg mRNA. Parallel control hybridization lacking either Actb or Actg probes demonstrates the specificity of fluorescence to the inclusion of the primary probe (Fig. 3, cf. panels C and C′ to panels B and B′ for Cy3 control, and cf. panels D and D′ to panels B and B′ for Cy5 control).
To control for the specificity of hybridization in situ, we designed three primary FISH-STIC probes against the mouse choline acetyl-transferase (ChAT) mRNA that would bind to the Cy5 secondary/dye ODN set. ChAT is not expressed in MEFs, and no specific hybridization could be detected, while the Actb mRNA labeled with Cy3 in the same MEFs appeared normal (Fig. 4). This control experiment demonstrates that FISH-STICs probes under the conditions we report are mRNA-specific and do not have intrinsic background binding.
FIGURE 4.
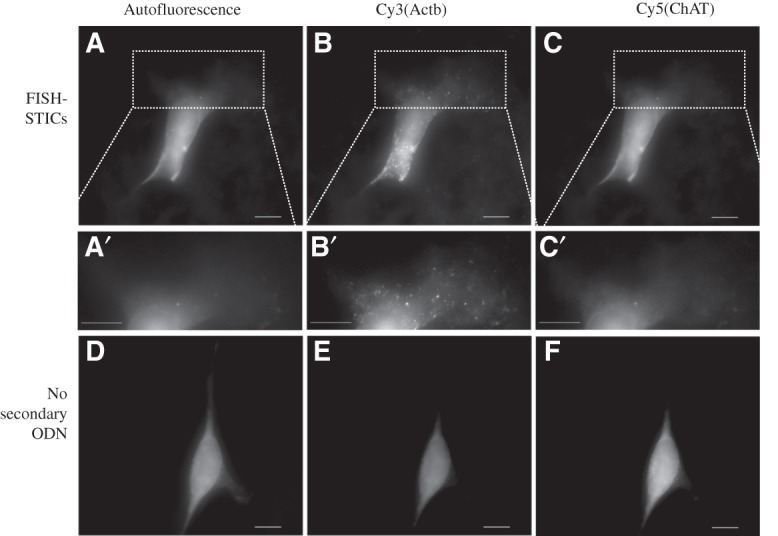
FISH-STICs probe specificity. Two Actb and three mouse choline acetyl-transferase (ChAT) primary probes were synthesized to label Actb mRNA with Cy3 and simultaneously label ChAT mRNA with Cy5. Probes were hybridized to primary MEFs and imaged with an epifluorescence microscope. (Top row) Images of FITC channel autofluorescence images (A), Cy3 (B), and Cy5 (C) from one cell. (Middle row) A′, B′, and C′ correspond to an expanded view of the ROI indicated by the dashed-line box in images A, B, and C, respectively. (Bottom row) Normalized images of FITC autofluorescence (D), Cy3 (E), and Cy5 (F) taken from one cell hybridized without a secondary ODN as an imaging control. (A–F) Maximum projection images of Z-series of images. Scale bars, 10 μm.
We next analyzed FISH-STIC images to quantify Actb and Actg mRNA distribution within the same cell by measuring the polarization index and dispersion index as reported by Park et al. (2012). These indexes quantify the distribution of an mRNA within the cell in relationship to the cell's morphology. They allow one to consider whether a population of mRNAs is more polarized in its distribution (polarity index) or uniform in its distribution throughout the cell (dispersion index). Actb mRNA is more polarized within MEFs than Actg mRNA as reflected by its higher median polarization index (PI, Actb = 0.359, Actg = 0.32) (Fig. 5). However, Actg mRNA is more evenly distributed throughout the cell than Actb mRNA is, reflected by its higher median dispersion index (DI, Actb = 0.434, Actg = 0.609) (Fig. 5). These results demonstrate the feasibility of FISH-STICs for multicolor mRNA detection and clearly establish that in mouse fibroblasts, Actb and Actg mRNA are under distinct regulatory processes that result in a quantifiably different distribution even in immortalized MEF cells.
FIGURE 5.
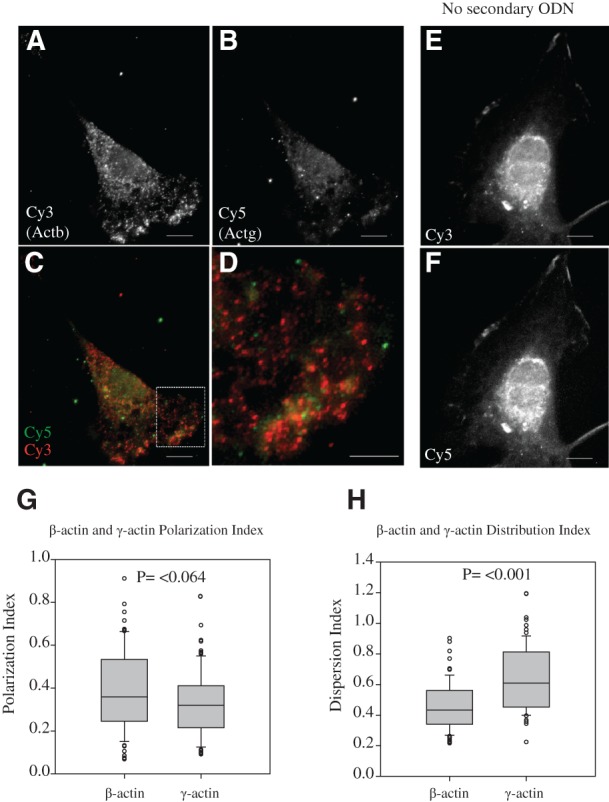
Actb and Actg have spatially distinct distribution in the same cells. Two Actb and two Actg primary probes were hybridized to primary MEFs and imaged with epifluorescence microscope. Representative normalized Cy3 images for Actb (A) or Cy5 for Actg (B). (C) The merged images, with the ROI indicated by the dashed box in C shown in panel D. Control images from hybridizations without secondary are shown for Cy3 (E) and Cy5 (F). The images shown are deconvoluted from Z-series taken at 60×. The Polarization index (G) and Distribution index (H) for 78 images are represented as box-whisker plots, with the median (black line) and middle quartiles represented in the box, the highest and lowest quartiles represented in the whiskers, and outliers indicated by circles. Polarization and Distribution indices were calculated from maximum projection images of nondeconvolved Z-series using a Mann–Whitney rank-sum test. Scale bars, 10 μm; (except for D) 2 μm.
To investigate whether FISH-STICs could be used in other cell types, we designed three primary FISH-STIC probes against the mouse Type-III Neuregulin 1 (Nrg1-III) isoform mRNA that would bind to the Cy3 secondary/dye ODN set. The Nrg1 gene produces numerous isoforms within different tissues due to alternative promoters and splice sites, and the type III isoform is neuron-specific in the central nervous system (Mei and Xiong 2008). We hybridized Nrg1 probes to hippocampal neurons plated on poly-lysine-coated glass coverslips. Nrg1-III and Actg mRNA were clearly detected in a secondary ODN-dependent manner; therefore, the FISH-STICs probes are applicable to other cell types (Fig. 6). The result also shows that the secondary and tertiary probe sets used can also be successfully applied to primary probes that detect other mRNAs.
DISCUSSION
Our FISH-STICs design is possible because commercial DNA synthesis technology has improved to be able to synthesize 150-mer ODNs reliably. Limitations to synthesis of commercial probes commercially come from the increased probability of premature truncation with ODN size during the synthesis, which goes from 3′ to 5′. By placing the antisense hybridizing sequences at the 5′ end, any truncated ODN will be unable to hybridize and not interfere with successful full-length probes. We first chose three sequential oligos for FISH-STIC probes because our experience using quintuply labeled single 50-mer ODNs indicated that the use of three sequential oligos for FISH-STICs would provide enough signal to be clearly visible with one set (Femino et al. 1998). We selected 35 nt and 25 nt for the intermediate tag sequences since these were large enough changes to accommodate decreasing stringency during successive steps, but variations in these lengths can easily be envisioned. Our tag sequences were generated through a random sequence-generating website, then screened by BLAST search to limit background complementarity, so any sequence lacking a high complementarity to existing RNA sequences in the cell can work.
Our design for FISH-STIC probes facilitates flexibility to increase fluorescence output of FISH target sites, an important parameter when considering the copy number of target transcripts. Multiple primary ODNs with a common secondary tag sequence to the same mRNA can all be cohybridized in the same probe mix, and this boosts fluorescence signals for an individual RNA sequence without changing any other parameter of our protocol. The probes here used two (Actb and Actg) or three (Nrg1-III and ChAT) primary ODNs with the same secondary tags, but more primary probes are certainly possible if much stronger signal is desirable. Also, one secondary/dye ODN set can also be used for many different primary probe sets (here, Actb and Nrg1-III used the same Cy3 set, and Actg and ChAT used the same Cy5 set), omitting the need to order a secondary/dye ODN set for every gene to be analyzed. A practical advantage to FISH-STICs is that all of the oligos used in this method can be ordered from any commercial ODN vendors that synthesize 150-bp ODNs, and they can be used without the need to couple dyes to modified ODNs in-house, which can be inefficient and adds additional time and cost to probe synthesis. The smallest scale available from our vendor at the time of writing this was 4 nmol of oligo for a 150-mer. Four nanomoles of oligo is sufficient to make 40 mL of probe solution at the concentration with which we started these studies (0.1 μM). We use 50 μL per coverslip; therefore, this scale of 150-mer is sufficient for 800 hybridization reactions, making this very inexpensive on a per-reaction basis. In some preliminary tests to optimize the FISH-STICs, the protocol works at 10-fold lower ODN concentration during hybridization, so quite likely one can get many more hybridizations than this from one probe (data not shown).
Importantly, the FISH-STIC concept should also be amenable to more than three consecutive probes to produce even stronger signals. Introducing another amplifying ODN between the primary and secondary or between the secondary and tertiary has the potential to make the individual 50-mer probes much brighter than we have demonstrated here. If we accommodated a second amplifying probe that incorporates four copies of a third unique repeated tag and modified the tertiary dye oligo to hybridize to this new third probe, then an individual primary mRNA binding site would be able to attract up to 60 individual fluorophores, an equivalent increase to three additional primary ODNs in our current configuration. In addition to individual mRNAs, FISH-STICs’ features make it possible to characterize noncoding RNAs as well as different mRNA isoforms produced in the same cell at the single-molecule level even when the isoforms differ by only as little as 50-nt or smaller, the size difference being limited by the ability of mismatches to the 50-mer to impair hybridization. This situation applies to alternative splicing, alternative transcription initiation, or alternative 3′-end cleavage and polyadenylation.
MATERIALS AND METHODS
Primer design
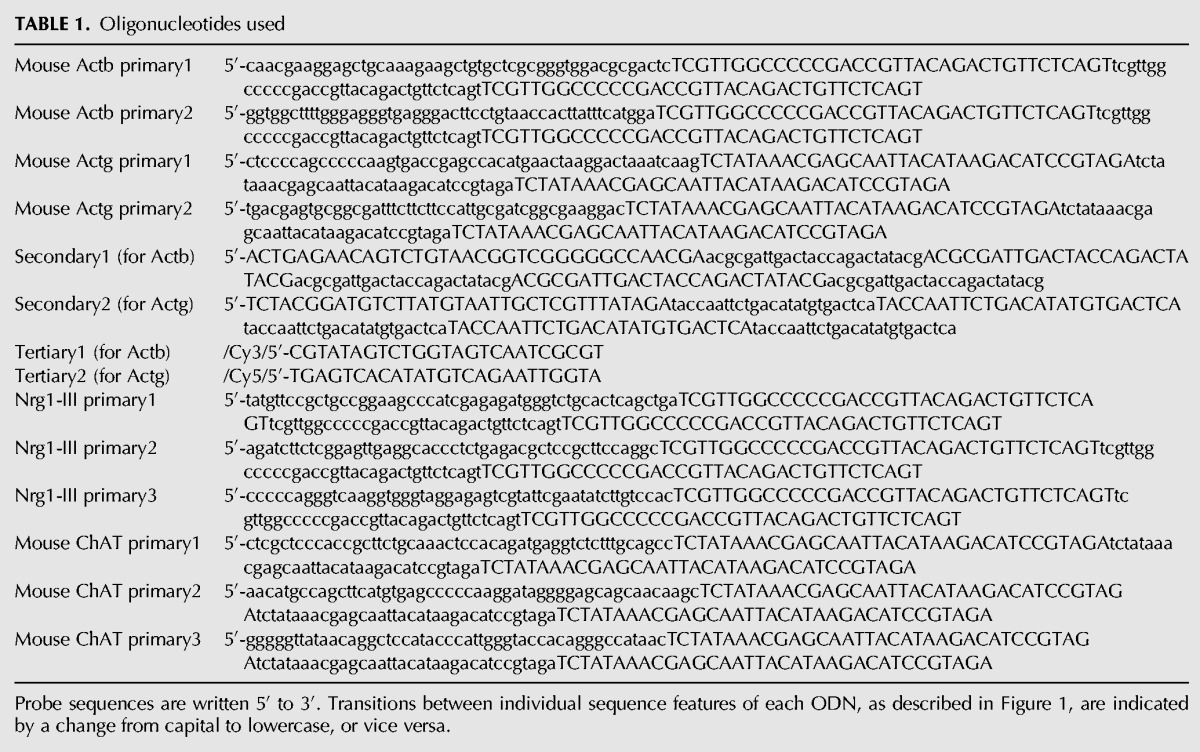
All ODN used are listed in Table 1. Primary ODNs consisted of a 45- to 50-mer sequence antisense to a gene-specific mRNA at the 5′ end of a DNA oligo, followed by three copies of a random 35-mer sequence. Multiple primary ODNs to the same mRNA were designed with nonoverlapping 50-mers complementary to different sequences within the same transcript but containing the same 35-mer repeated sequence. The secondary ODNs contain a 35-mer complementary to the 35-mer of the primary ODN at the 5′ end, followed by five copies of a distinct random 25-mer. The tertiary or dye ODN is a 25-mer complementary to the 25-mer in the secondary ODN and contains a fluorescent dye at the 5′ end (Cy3 for the Actb probes and Cy5 for the Actg probes). All DNA sequences were targeted to consist of 50% G-C base pairs, with actual ratios varying between 40% and 60%. Individual antisense 50-mer and randomly generated 35-mer and 25-mer sequences were subjected to BLAST search to minimize the potential to cross-hybridize to other mRNA sequences in the genome. Typically, 14–16 continuous bases were the largest stretch of complementary sequence found in potential off-target sequences. Primary and secondary oligonucleotides were purchased as standard-desalted Ultramers from Integrated DNA Technologies (IDT); dye oligo was ordered with the indicated dye at the 5′ end from synthesis with purification standard for labeled ODNs (IDT).
TABLE 1.
Oligonucleotides used
Cell culture
Primary mouse embryonic fibroblasts (MEFs) were isolated from E14 mouse embryos by standard procedures and immortalized by transfection with SV40 middle T antigen–expressing plasmid (Lu et al. 2004). Cells were maintained in DMEM with 10% FBS with 10 μg/mL gentamicin (D10). MEFs were plated at a density of 25,000 cells on coated 18 mM coverslips in a 12-well culture dish in D10. The coverslips were coated using 50 μg/mL poly-l-lysine in boric acid buffer (50 mM boric acid, 5 mM sodium tetraborate at pH 8.5) overnight at room temperature, then washed in sterile water prior to adding cells. The cells were allowed to attach and grow overnight before being fixed using four twofold dilutions of 4% paraformaldehyde with 1 mM MgSO4. Cells were allowed to fix in the final dilution for 20 min. The cells were then washed in PBS with 0.1 M glycine (PBSG) for 10 min and then permeabilized and stored in 80% methanol overnight at −20°C.
Neuronal cultures were maintained according to the procedure described previously (Sinnamon et al. 2012). Briefly, E18 timed pregnant mice were sacrificed using CO2 in accordance with IACUC protocols. Cortices were isolated from the pups, trypsinized, dissociated, and plated in neurobasal supplemented with B27, primocin, and glutamax. After 3 d, in vitro cultures were treated with 3 μM FDU. Following the indicated days in culture, the cells were fixed using four twofold dilutions of 4% paraformaldehyde with 1 mM MgSO4. Cells were allowed to fix in the final dilution for 20 min. The cells were then washed in PBSG for 10 min and then permeabilized and stored in 80% methanol overnight at −20°C.
FISH probe preparation
Probe mixes were 50 μL per coverslip and assembled for each experiment from concentrated stocks. Once probe mixes were assembled, they were heated for a minute to 65°C immediately prior to use.
Primary probe mix
The primary probe mix contained 2× SSC (300 mM NaCl, 30 mM sodium citrate), 10% dextran sulfate, 40% formamide, 0.1 μM each primary ODN for each gene hybridized, 20 μg/mL sheared salmon sperm DNA, 20 μg/mL Eschierichia coli RNase-free tRNA, 0.4% SDS.
Secondary probe mix
The secondary probe mix contained 2× SSC, 10% dextran sulfate, 35% formamide, 0.1 μM each secondary probe corresponding to the primary probes used, 20 μg/mL sheared salmon sperm DNA, 20 μg/mL E. coli RNase-free tRNA, 0.4% SDS.
Tertiary probe mix
The tertiary probe mix contained 2× SSC, 10% dextran sulfate, 20% formamide, and 0.1 μM each tertiary probe used.
Assembly of a humidified chamber
A piece of Parafilm was spread in the bottom of a 15-cm plastic culture dish. Fifty microliters of probe solution was placed on the Parafilm without leaving air bubbles, leaving enough distance between probes so that coverslips will not contact each other during incubation. Coverslips were placed onto drops of probe as described below. A centrifuge tube cap full of PBS was added in the corner to keep humidity in the chamber during incubation. The lid on the culture was sealed on the vessel by wrapping it with Parafilm around all the edges.
In situ hybridization
Coverslips with fixed cells in 80% methanol from above were warmed to room temperature and serially rehydrated by five successive twofold dilutions with 2× SSC/40% formamide, followed by one complete change into 2× SSC/40% formamide. After 5 min, coverslips were placed onto the primary probe (prepared as above) cells-side down in a humidified chamber as above and incubated overnight at 37°C. All steps from here forward were performed in a 37°C warm room, and all reagents were kept at 37°C. The coverslips were gently pried off the Parafilm, individually placed cells-side up into separate wells of a six-well culture dish with 3 mL of 2× SSC/40% formamide, and then rocked gently for 15 min. We used a two-dimensional (2D) rocking platform for all washing set at 45 oscillations per minute. This wash was repeated for three 15-min intervals, and then buffer was changed to 2× SSC, 35% formamide to equilibrate the coverslips for the secondary hybridization. Coverslips were placed cells-side down on a drop of secondary probe mixture (prepared as above) in a hybridization chamber. The chamber was sealed with Parafilm and incubated for 3 h. The coverslips were gently pried off the Parafilm, individually placed cells-side up into separate wells of a six-well culture dish with 3 mL of 2× SSC/35% formamide, and then rocked gently for 15 min. This wash was repeated for three 15-min intervals, and then the buffer was changed to 2× SSC, 20% formamide to equilibrate the coverslips for the tertiary hybridization. Coverslips were placed cells-side down on a drop of tertiary probe mixture (prepared as above) in a hybridization chamber. The chamber was sealed with Parafilm, covered with aluminum foil, and incubated for 3 h. The coverslips were gently pried off the Parafilm, individually placed cells-side up into separate wells of a six-well culture dish with 3 mL of 2× SSC/20% formamide, and then rocked for 15 min. This wash was repeated for three 15-min intervals and then the buffer was changed to 1× SSC, 0.05% Tween 20, and 300 nM DAPI and rocked for 15 min. Cells were rinsed two times in 1× SSC, then mounted in hard-set anti-fade microscopy mounting medium according to the manufacturer's recommendations, and used for microscopy.
Image acquisition and analysis of mRNA dispersion and polarization
Epifluorescence micrographs were obtained using an epifluorescence microscope (Nikon TiE) using a Cool Snap HQ2 or QuantEM digital camera. To be able to compare the images shown, fluorescence micrographs from the same wavelengths (Cy3 or Cy5) within an individual experiment were acquired with the same exposure time, and the display scales of the representative images from each condition were equalized. For mRNA distribution analysis, serial Z-sections (0.5-μm steps, between 5 and 7 μm total distances) were acquired, and a maximum projection image was generated using the Nikon Elements software. For quantification of the polarization and distribution of mRNAs, a manual mask was generated using ImageJ, and the dispersion and polarization indices were calculated using the script described (Park et al. 2012). Cells that contained bright STIC probe aggregates were not imaged for mRNA distribution analysis.
ACKNOWLEDGMENTS
We thank Hye-Yoon Park and Robert Singer for training on the script for RNA analysis. This work was supported by research funds supplied by the Stony Brook School of Medicine.
REFERENCES
- Bassell GJ, Zhang H, Byrd AL, Femino AM, Singer RH, Taneja KL, Lifshitz LM, Herman IM, Kosik KS 1998. Sorting of β-actin mRNA and protein to neurites and growth cones in culture. J Neurosci 18: 251–265 [DOI] [PMC free article] [PubMed] [Google Scholar]
- Collins ML, Irvine B, Tyner D, Fine E, Zayati C, Chang C, Horn T, Ahle D, Detmer J, Shen LP, et al. 1997. A branched DNA signal amplification assay for quantification of nucleic acid targets below 100 molecules/ml. Nucleic Acids Res 25: 2979–2984 [DOI] [PMC free article] [PubMed] [Google Scholar]
- Femino AM, Fay FS, Fogarty K, Singer RH 1998. Visualization of single RNA transcripts in situ. Science 280: 585–590 [DOI] [PubMed] [Google Scholar]
- Femino AM, Fogarty K, Lifshitz LM, Carrington W, Singer RH 2003. Visualization of single molecules of mRNA in situ. Methods Enzymol 361: 245–304 [DOI] [PubMed] [Google Scholar]
- Grunwald D, Singer RH, Czaplinski K 2008. Cell biology of mRNA decay. Methods Enzymol 448: 553–577 [DOI] [PMC free article] [PubMed] [Google Scholar]
- Hill MA, Gunning P 1993. β and γ actin mRNAs are differentially located within myoblasts. J Cell Biol 122: 825–832 [DOI] [PMC free article] [PubMed] [Google Scholar]
- Huttelmaier S, Zenklusen D, Lederer M, Dictenberg J, Lorenz M, Meng X, Bassell GJ, Condeelis J, Singer RH 2005. Spatial regulation of β-actin translation by Src-dependent phosphorylation of ZBP1. Nature 438: 512–515 [DOI] [PubMed] [Google Scholar]
- Itzkovitz S, van Oudenaarden A 2011. Validating transcripts with probes and imaging technology. Nat Methods 8: S12–S19 [DOI] [PMC free article] [PubMed] [Google Scholar]
- Lawrence JB, Singer RH 1986. Intracellular localization of messenger RNAs for cytoskeletal proteins. Cell 45: 407–415 [DOI] [PubMed] [Google Scholar]
- Lu PD, Jousse C, Marciniak SJ, Zhang Y, Novoa I, Scheuner D, Kaufman RJ, Ron D, Harding HP 2004. Cytoprotection by pre-emptive conditional phosphorylation of translation initiation factor 2. EMBO J 23: 169–179 [DOI] [PMC free article] [PubMed] [Google Scholar]
- Mei L, Xiong WC 2008. Neuregulin 1 in neural development, synaptic plasticity and schizophrenia. Nat Rev Neurosci 9: 437–452 [DOI] [PMC free article] [PubMed] [Google Scholar]
- Park HY, Trcek T, Wells AL, Chao JA, Singer RH 2012. An unbiased analysis method to quantify mRNA localization reveals its correlation with cell motility. Cell Rep 1: 179–184 [DOI] [PMC free article] [PubMed] [Google Scholar]
- Player AN, Shen LP, Kenny D, Antao VP, Kolberg JA 2001. Single-copy gene detection using branched DNA (bDNA) in situ hybridization. J Histochem Cytochem 49: 603–612 [DOI] [PubMed] [Google Scholar]
- Qian X, Lloyd RV 2003. Recent developments in signal amplification methods for in situ hybridization. Diagn Mol Pathol 12: 1–13 [DOI] [PubMed] [Google Scholar]
- Raj A, van den Bogaard P, Rifkin SA, van Oudenaarden A, Tyagi S 2008. Imaging individual mRNA molecules using multiple singly labeled probes. Nat Methods 5: 877–879 [DOI] [PMC free article] [PubMed] [Google Scholar]
- Rodriguez AJ, Shenoy SM, Singer RH, Condeelis J 2006. Visualization of mRNA translation in living cells. J Cell Biol 175: 67–76 [DOI] [PMC free article] [PubMed] [Google Scholar]
- Sinnamon JR, Waddell CB, Nik S, Chen EI, Czaplinski K 2012. Hnrpab regulates neural development and neuron cell survival after glutamate stimulation. RNA 18: 704–719 [DOI] [PMC free article] [PubMed] [Google Scholar]


