FIGURE 5.

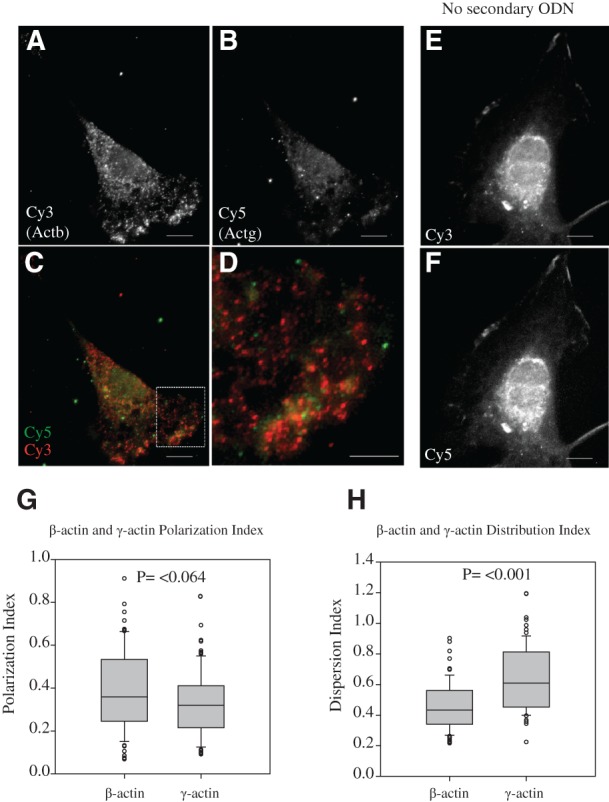
Actb and Actg have spatially distinct distribution in the same cells. Two Actb and two Actg primary probes were hybridized to primary MEFs and imaged with epifluorescence microscope. Representative normalized Cy3 images for Actb (A) or Cy5 for Actg (B). (C) The merged images, with the ROI indicated by the dashed box in C shown in panel D. Control images from hybridizations without secondary are shown for Cy3 (E) and Cy5 (F). The images shown are deconvoluted from Z-series taken at 60×. The Polarization index (G) and Distribution index (H) for 78 images are represented as box-whisker plots, with the median (black line) and middle quartiles represented in the box, the highest and lowest quartiles represented in the whiskers, and outliers indicated by circles. Polarization and Distribution indices were calculated from maximum projection images of nondeconvolved Z-series using a Mann–Whitney rank-sum test. Scale bars, 10 μm; (except for D) 2 μm.
