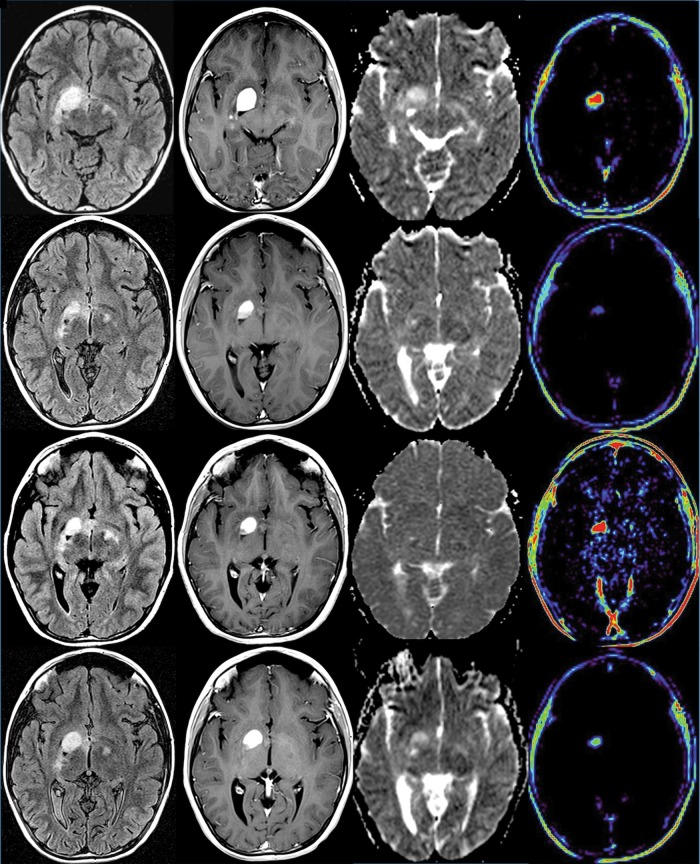
Fig. 2.
A 10-year-old girl (patient #30, Table 4) with primarily right optic pathway tumor extending into the right basal ganglia, with MRI at baseline (row 1), at 15 days (row 2), at 3 months (row 3), and off therapy at 9 months (row 4). Axial MRI from FLAIR (column 1), T1 images with gadolinium (column 2), apparent diffusion coefficient (ADC) maps (column 3), and T1 permeability maps (column 4). There is a decrease in FLAIR volume and enhancing volume over time. Permeability maps demonstrate a reduction in Kps values between baseline and day 15 and continuing to be present at 9 months. There is a transient increase in permeability at 3 months, without an increase in the volume of tumor. ADC maps demonstrate a reduction in the ADC values within the tumor from day 0 to day 15, likely due to edema reduction in the tumor that continues until 3 months after therapy and gradually increases at 9 months.

