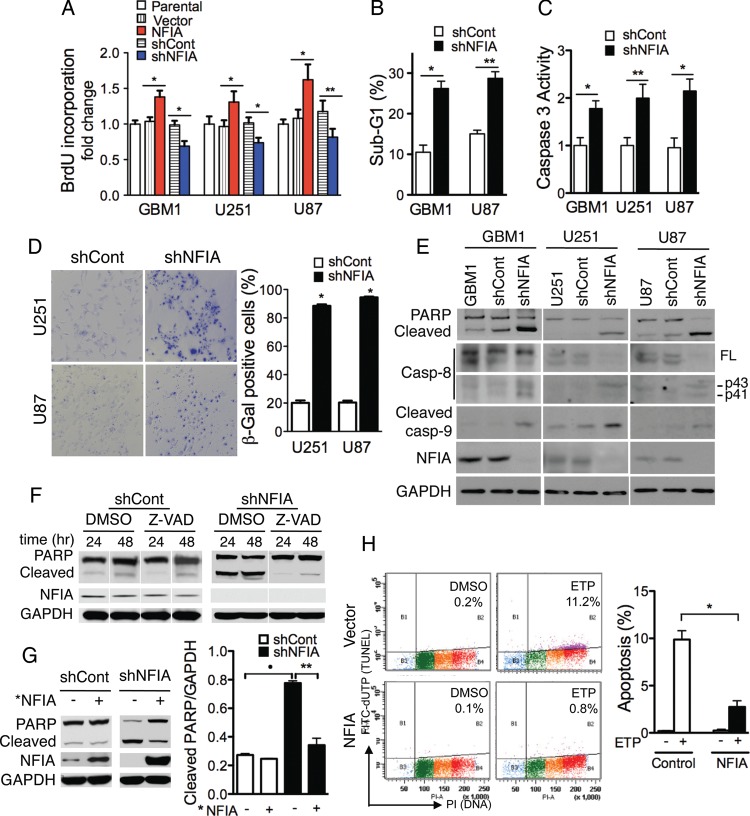
Fig. 2.
NFIA controls proliferation and cell death. (A) NFIA promotes and shNFIA inhibits proliferation (BrdU uptake) of glioma cells freshly transduced with lentivirus expressing NFIA (red), shNFIA (blue), and controls. Means ± SD of 3 different experiments performed in 3 to 8 replicates; *P < .0001, **P < .05. (B) Knockdown of NFIA increases sub-G1 fraction of glioma cells. GBM1 or U87 glioma cells transduced with shNFIA or control analyzed by propidium iodide (PI) on day 3 after lentiviral infection; n = 3; *P < .0005, **P < .0001. (C) NFIA silencing increases caspase-3 activity. Caspase-3 activity was determined on day 3 after infection with shNFIA or shCont; n = 3; *P < .005, **P < .01. (D) Glioma cells infected with shNFIA or control shRNA were stained with SA-β-gal (x400) on day 3 of transduction. Quantification of SA-β-gal positive cells is on the right panel; n = 3, *P < .0001. Knockdown of NFIA is shown in panel E. (E) Loss of NFIA causes apoptosis evidenced by cleavage of PARP, caspase-8, and caspase-9. Whole cell lysates of glioma cells analyzed on day 3 after infection with shNFIA, vector control, or uninfected parental cells (immunoblotting). Shown is a representative experiment of 3 experiments. (F) Caspase inhibitor, Z-VAD, blocks shNFIA-induced PARP cleavage. Whole-cell lysates of shNFIA and control-infected U251 glioma cells 3 days after lentiviral infection and cultured with Z-VAD-fmk (20 μM) or vehicle (DMSO) for additional 24 and 48 hours were analyzed by immunoblotting. (G) *NFIA (protein coding domain only, resistant to the shNFIA) reverses shNFIA-induced PARP cleavage in U251 glioma cells. After 24 hour infection with shNFIA or control in U251, cells were reinfected with *NFIA for 48 hours and analyzed for PARP cleavage (left). Right panel: densitometric quantification; *P<.001, **P<.01. (H) NFIA protects glioma cells from etoposide-induced apoptosis. U251 glioma cells stably expressing NFIA or vector were treated with vehicle (DMSO) or etoposide (ETP, 1 μg/mL) in serum-free medium for 24 hours. Apoptosis was assessed using the Apo-Direct kit. Left panel: representative experiment of 3 experiments. The percentage of apoptotic cells (FITC-dUTP+ cells in top quadrants) is indicated for each condition. Right panel: means ± SD from 3 experiments; *P < .0001.

