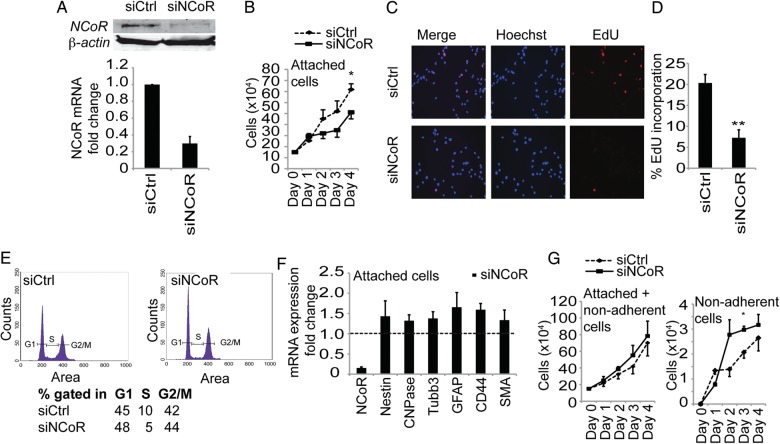
Fig. 1.
NCoR regulates tumor cell growth. The glioblastoma multiforme cell line U87 grew in 2 separate cell populations in vitro, with cells growing attached to the cell plastic surface and other cells growing as anchorage-independent cell colonies. (A) Reduction of NCoR mRNA and protein levels upon delivery of short interfering RNA. (B) Growth curve of siCtrl cells and siNCoR cells in a period of 4 days after knockdown in the cell population growing attached to the plastic surface. Data include 4 biological replicates. Error bars represent standard error of the means (SEM). * P = .05 with Student t test on day 4. (C) EdU incorporation in the attached growing cells analyzed 48 hours after knockdown. (D) Quantification of EdU incorporation reveals a significant decrease in EdU incorporation (**P = .009 with Student t test). Data presented as percent cells with EdU staining and include 3 biological replicates. Error bars represent SEM. Statistics calculated with Student t test. (E) Flow cytometry on control and NCoR knockdown cells. Experiment performed in 3 biological replicates and one representative graph is shown. Percentage of cells gated in G1, S and G2/M and percent of BrDU incorporated cells. (F) mRNA expression levels of differentiation markers after knockdown of NCoR in the attached cells. Data include 4 biological replicates and are presented as fold over the control knockdown cell mRNA levels (shown as a dashed line). Error bars represent SEM. (G) Growth curve of the entire U87 cell population, including both attached and nonadherent cells, in a period of 4 days after knockdown. (H) Growth curve specifically of nonadherent cells. Data include 4 biological replicates. Error bars represent SEM. Student t test shows a significant change on day 3 (P = .03).

