Fig. 2.
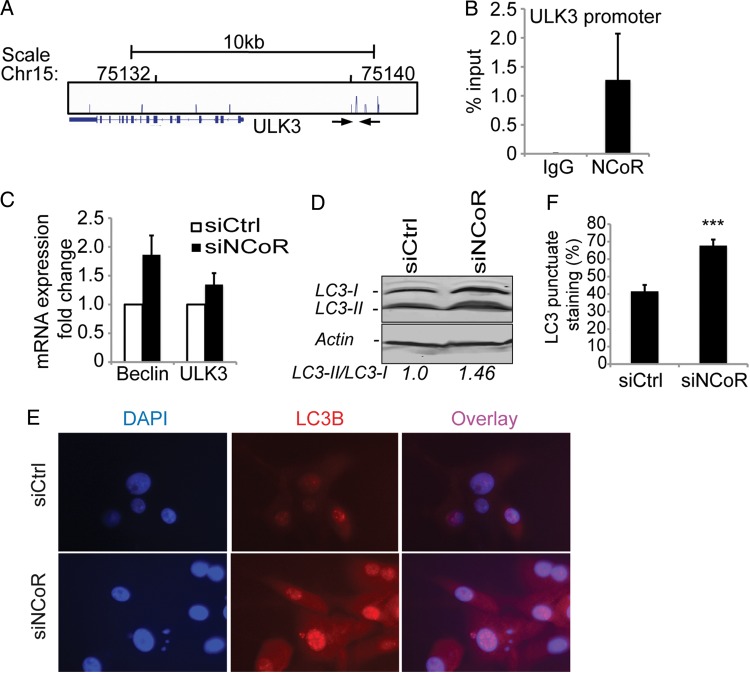
Induction of an autophagy response in attached cells upon NCoR knockdown. A genome-wide ChIP-seq analysis of NCoR occupancy in U87 cells identified ∼1600 binding sites. (A) One identified NCoR peak is located in the autophagy gene ULK3 promoter. (B) ChIP-qPCR confirmed this peak. Data presented as percent input and include 3 biological replicates. Error bars represent represent standard error of the means (SEM). The location of the used primers spanning the identified ChIP-seq peak is indicated with arrows in (A). (C) mRNA expression levels of the autophagy genes Beclin and ULK3 upon NCoR knockdown. Data presented as a fold change over control knockdown cell mRNA levels and include 4 biological replicates. Error bars represent SEM. (D) Western blot showing a 46% increase in the lipidation of LC3 upon NCoR knockdown in the attached cells. β-actin was used as a loading control, and ImageJ was used for band quantification. (E) An increased nuclear localization and punctate staining of LC3 in NCoR-deficient cells is observed with immunostainings. (F) Quantification of percentage of cells containing a punctate nuclear staining. The significant difference shown was calculated with Student t test; P = 1 × 10⁻⁵.

