
Fig. 4.
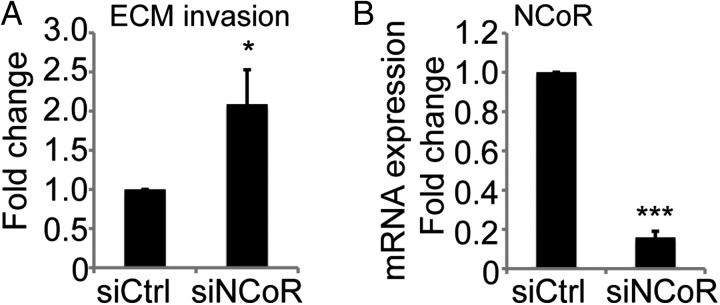
Knockdown of NCoR increases the invasive properties of U87 cells. (A) Invasion properties analysed by counting the number of transwell invasive cells in a Boyden chamber coated with extracellular matrix. Data presented as fold change over control knockdown cells. Data include 3 biological replicates. Error bars represent standard error of the means. Statistics calculated with Student t test; P = .04 (B) Level of NCoR knockdown on mRNA expression from the 3 biological replicates in (A). Data presented as fold change from control knockdown cells and statistics calculated with Student t test; P = 2 × 10⁻⁷.