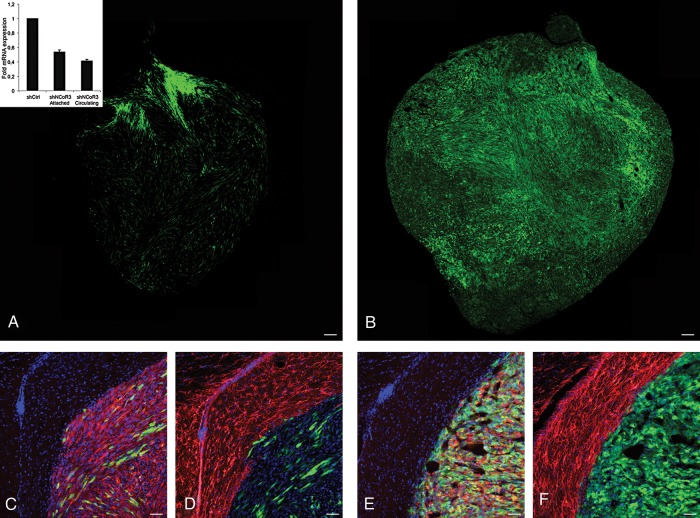
Fig. 6.
In vivo tumor formation after transplantation with U87 cells treated with shRNA against NCoR vs control. Tumor formation capacity examined in mice injected with stably transduced GFP-tagged U87 shControl or shNCoR knockdown glioblastoma cells into the right striatum. Overview of tumor formed 3 weeks after injection of control U87 cells (A) and NCoR knockdown cells (B). Staining with Nestin (red) and DAPI (blue) shown together with GFP (injected cells) at the tumor boundary from control (C) and NCoR knockdown (E). Staining with the astrocytic marker GFAP (red) shown together with DAPI (blue) and GFP from control (D) and NCoR knockdown (F) Tumor. mRNA expression levels of NCoR in the stable lines (insert in A). Scale bars represent 100 µm (A and B) and 50 µm (C–F).

