Abstract
Probability weighting functions relate objective probabilities and their subjective weights, and play a central role in modeling choices under risk within cumulative prospect theory. While several different parametric forms have been proposed, their qualitative similarities make it challenging to discriminate among them empirically. In this paper, we use both simulation and choice experiments to investigate the extent to which different parametric forms of the probability weighting function can be discriminated using adaptive design optimization, a computer-based methodology that identifies and exploits model differences for the purpose of model discrimination. The simulation experiments show that the correct (data-generating) form can be conclusively discriminated from its competitors. The results of an empirical experiment reveal heterogeneity between participants in terms of the functional form, with two models (Prelec-2, Linear in Log Odds) emerging as the most common best-fitting models. The findings shed light on assumptions underlying these models.
Cumulative Prospect Theory (CPT; Luce and Fishburn, 1991; Tversky and Kahneman, 1992) comprises two key transformations: one of outcome values and the other of objective probabilities. Risk attitudes are derived from the shapes of these transformations, as well as their interaction (see Zeisberger et al., 2011, for a demonstration of the interaction effects). The focus of this paper is on the latter of these two transformations, the transformation of objective probabilities, which is commonly referred to as the ‘probability weighting function.’ The probability weighting function is of particular interest because, along with gain-loss separability, it is what separates CPT from EU and allows it to accommodate the classical “paradoxes” of risky decision making, such as the common consequence effect (e.g., the Allais paradox; Allais, 1953), the common-ratio effect, the fourfold pattern of risk preferences, and the simultaneous attraction of lottery tickets and insurance (Burns et al., 2010).
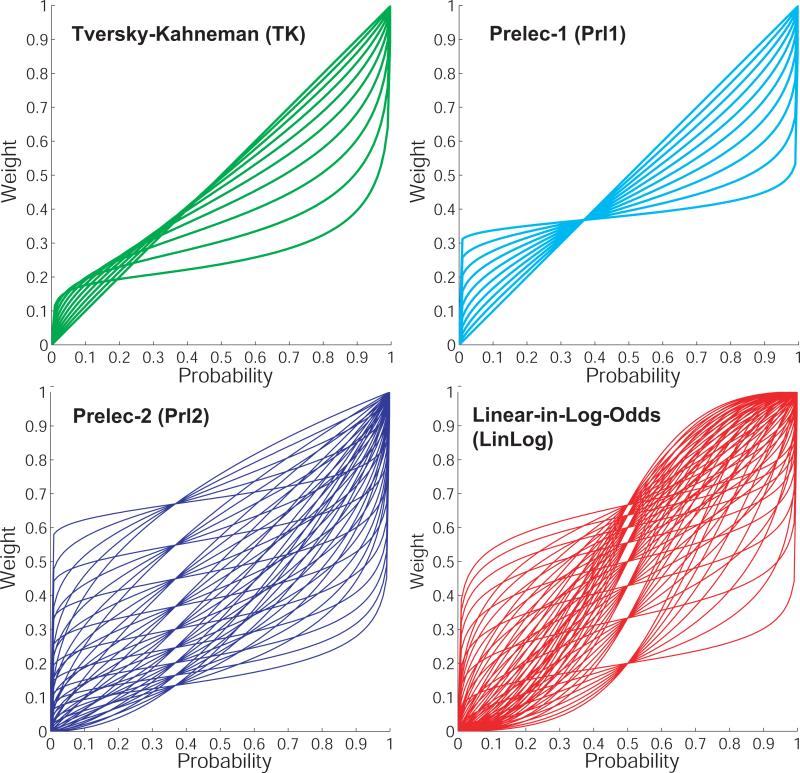
While there is now a general consensus about the qualitative shape of the probability weighting function (inverse sigmoid), numerous functional forms have been proposed (See Figure 1). Some forms are derived axiomatically (e.g., Prelec, 1998; Diecidue et al., 2009), others are based on psychological factors (e.g., Gonzalez and Wu, 1999), and still others seem to have no normative justification at all (e.g., Tversky and Kahneman, 1992). As a result, CPT as a quantitative utility model is only loosely defined. Each functional form of the probability weighting function, embedded in the CPT framework, yields a different model with potentially different implications for choice behavior. Thus, while the inclusion of a probability weighting function of any form allows prospect theory to outperform EU in describing human choice data, there is no settled-upon instantiation of prospect theory as a quantitative model.
Figure 1.
Four families of functions that have been proposed for the probability weighting function in Cumulative Prospect Theory. Each function is plotted for a range of its parameters: TK from 0.3 to 1.0 in increments of 0.7; Prl1 from 0.1 to 1.0 in increments of 0.1, Prl2 from 0.2 to 1.0 for it's curvature parameter and 0.4 to 2.0 for its elevation parameter, each in increments of 0.2, and LinLog from 0.25 to 2.0 for both its curvature and elevation parameters, both in increments of 0.25. The functional forms are given in Section 3.
Despite the functional and theoretical differences between forms of the probability weighting function, attempts to identify the form that best describes human data have yielded ambiguous results. Gonzalez and Wu (1999) compared the fits of one- and two-parameter probability weighting functions and found that only one parameter was required to describe aggregate choice data while two parameters were required to describe individual choice data. However, Stott (2006) found that the performances of one- and two-parameter forms depend on assumptions about the other component functions in CPT, such as the value function. In particular, when the surrounding functions have a worse fit, the extra parameter in the weighting function can play a compensating role. His study favored Prelec's (1998) one-parameter form for individual choice data, but only when it was paired with particular forms of the value function.
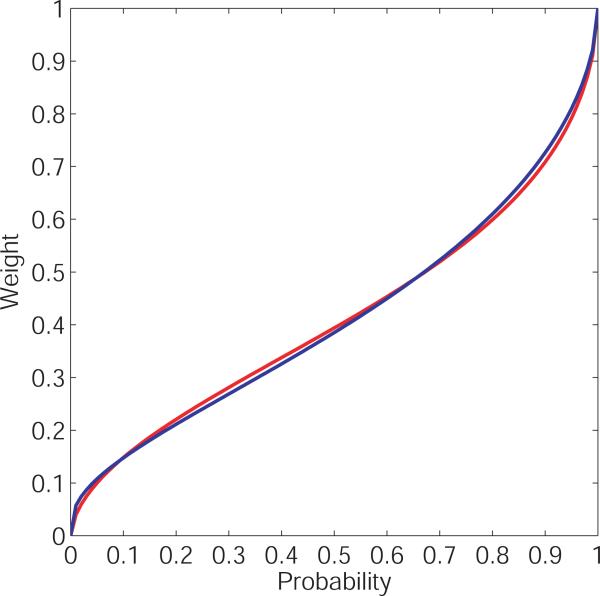
Judging by a visual inspection of the shapes of the probability weighting curves (Figure 1), it is not surprising that the forms are so difficult to discriminate. For example, Figure 2 shows the Linear-in-Log-Odds (LinLog) form with parameter values obtained empirically by Abdellaoui (2000) along side Prelec's two parameter form (Prl2) with parameter values obtained through trial and error to visually approximate the LinLog curve. The curves appear to be virtually identical. Given that the curves can mimic one another so closely, one might wonder whether it really matters which functional form is used. If two forms are so similar as to be impossible to discriminate empirically, then the debate over which one most closely approximates human decision making is uninteresting. However, to the extent that the functions can be discriminated empirically with choice data, we should do our best to compare them and thereby sharpen our understanding of probability weighting in risky choice.
Figure 2.
Linear-in-Log-Odds (LinLog) probability weighting function with the empirically estimated parameter values reported by Abdellaoui (2000), along side Prelec's two-parameter form (Prl2) with parameter values obtained through trial and error to visually approximate the LinLog curve.
In this paper, we investigate the extent to which functional forms of the probability weighting function are discriminable in practice, and attempt to identify which functional form best describes human choice behavior. We do this by conducting experiments in which the choice-stimuli are optimized for discriminating between functional forms, using Adaptive Design Optimization (ADO; Cavagnaro et al., 2010). ADO is a computer-based experimentation methodology in which choice-stimuli (e.g., pairs of monetary gambles) are adapted in real-time in response to choices made by participants. Instead of using a preselected set of gambles to test the predictions of different theories, ADO searches the entire feasible gamble space and extracts the most informative, discriminating stimuli to present at that point in the experiment. ADO has proven to be effective in memory experiments for discriminating among a subset of models of memory retention (Cavagnaro et al., 2011), and has discriminated between the “Original” and “Cumulative” versions of Prospect Theory in computer-simulation experiments (Cavagnaro et al., 2013). In this paper, we apply ADO to the problem of discriminating among functional forms of the probability weighting function in CPT.
The framework of the experiments in which we apply ADO is based on the two-alternative forced-choice paradigm for eliciting preferences, which has been shown to outperform calibration methods based on indifference judgments or certainty equivalents (Daniels and Keller, 1992). In each trial of an experiment, ADO selects a pair of three-outcome gambles for presentation, and the participant must choose the preferred gamble. While most of the literature is built on two-outcome gambles, the move to three-outcome gambles expands the space of possible stimuli, potentially allowing for greater discrimination between functional forms. To make ADO tractable in this framework, all gambles in the experiment have the same, three possible outcomes, varying only in probabilities. This simplification makes it possible to estimate the probability weighting function without having to assume a functional form for the utility of outcome values. The analysis also acknowledges the presence of noise in the data while making only minimal assumptions about the structure of the noise.
We conducted both simulation studies and actual experiments using the above method. Simulation experiments were conducted using the ADO methodology to determine the extent to which the models are discriminable. Extending the simulation experiments, we conducted an experiment with human participants to simultaneously discriminate between four of the most commonly used weighting functions in CPT. Results of the experiments show heterogeneity between participants, not only in the shape of the probability weighting function, which is consistent with the findings of Gonzalez and Wu (1999) and Donkers et al. (2001), but also in the functional form of the probability weighting function. Further analyses probe these individual differences to identify the specific inadequacies of each model that can cause them to fail. Overall, the linear-in-log-odds form is favored as long as the probability weighting function is not too highly elevated, in which case the Prelec's two-parameter form is favored instead. In addition, our results suggest that when Prelec's two-parameter form fails, it is due to violations of subproportionality.
1 How ADO works
An ADO framework for discriminating among models of risky choice was presented by Cavagnaro et al. (2013); Chaloner and Verdinelli (1995). In this framework, an experiment proceeds across a sequence of stages, or mini-experiments, in which the design at each stage (e.g., a set of one or more choice stimuli) is optimized based on the data observed in preceding stages. Optimizing the design means identifying and using the design that is expected to provide the most useful information possible about the models under investigation. The optimization problem to be solved at each stage is formalized as a Bayesian decision problem in which the current state of knowledge is summarized in prior distributions, which are incorporated into an objective function to be maximized. New information gained from observing the result of a mini-experiment is immediately incorporated into the objective function via Bayesian updating of the prior distributions, thus improving the optimization in the next mini-experiment.
Formally, the objective function to be maximized at each stage can be formulated as
| (1) |
where s (= 1,2,...) is the stage of experimentation, m (= 1,2,..., K) is one of K models under consideration, d is an experimental design to be optimized, and y is the choice outcome of a mini-experiment with design d. In the above equation, ps(y|m, d) = ∫θ p(y|θm, d)ps(θm)dθm is the marginal likelihood of the outcome y given model m and design d, which is the average likelihood weighted by the parameter prior ps(θm). Here, p(y|θm, d) is the likelihood function that specifies the probability of the outcome y given the parameter value θm under model k. For instance, for a choice experiment between two gambles, the likelihood function would be a binomial likelihood. The expression is the “grand” marginal likelihood, obtained by averaging the marginal likelihood across K models weighted by the model prior ps(m). Equation 1 is called the “expected utility” of the design d because it measures, in an information theoretic sense, the expected reduction in uncertainty about the true model that would be provided by observing the outcome of a mini-experiment conducted with design d (Cavagnaro et al., 2010).
On stage s of an ADO experiment, the design to be implemented in the next mini-experiment is chosen by maximizing U(d). Upon the observation of a specific experimental outcome zs in that mini-experiment, the prior distributions to be used to find an optimal design for the next stage are updated via Bayes rule and Bayes factor calculation (e.g., Gelman et al., 2004) according to the following equations
| (2) |
| (3) |
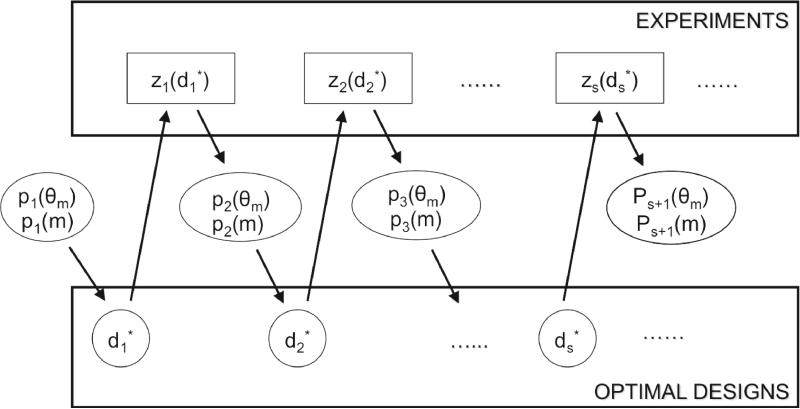
In the equation is the Bayes factor that is defined as the ratio of the marginal likelihood of model k to that of model m given the outcome zs and optimal design (Kass and Raftery, 1995). To recap, the ADO process involves, in each stage of experimentation, finding the optimal design by maximizing the utility function U(d), conducting a mini-experiment with the optimized design, observing an outcome zs, and updating the model and parameter priors to the corresponding posteriors through Bayes rule, as illustrated in Figure 3. This process continues until one model emerges as a clear winner under some appropriate stopping criterion, such as ps(m) > 0.99.
Figure 3.
Schematic illustration of the sequential steps of ADO.
Before closing this section, we discuss two noteworthy features of ADO. Firstly, an advantage of ADO is that model fitting and model selection are incorporated into the procedure for selecting optimal designs. Model fitting is done through Bayesian updating of the parameter estimates, and model selection can be done through comparing the marginal likelihoods of the models. More precisely, the posterior probability of model m after s stages, in which choices y1, . . . , ys were observed, is defined as the ratio of the marginal likelihood of y1, . . . , ys given m to the sum of the marginal likelihoods of y1, . . . , ys given each model under consideration, where the marginal is taken over the prior parameter distribution. The ratio of the posterior probabilities of two models yields the Bayes factor (Kass and Raftery, 1995). It is worth noting that the Bayes factor, as a model selection measure, will properly account for model complexity or flexibility so as to avoid over-fitting, unlike measures that assess only goodness of fit such as r2 (e.g., Myung, 2000, p. 199).
Secondly, given that the priors are updated independently for each participant, each participant in a risky choice experiment could respond to different choice-stimuli that are best suited to the participant's particular preferences. Thus, ADO's efficiency partially derives from adapting to an individual's unique behavior. Furthermore, the Bayesian foundation of ADO gives it flexibility to accommodate various forms of stochastic error, which is essential for adequately describing real choice data (e.g., Hey, 2005). For example, if a stochastic error function is assumed such that p(y|m, d, ε) is the probability of the outcome y in a mini-experiment with design d given that the true model is m with stochastic error parameter ε, then the likelihood function p(y|m, d) in Equation 1 is obtained by marginalizing p(y|m, d, ε) with respect to the prior on ε.
2 Illustrative example of Model Discrimination using ADO
As a prelude to the simulation experiment, we illustrate the problem of model discrimination and how ADO assists in the process. Although the two curves depicted in Figure 2 are very similar, they are not so similar as to imply the same choice predictions in every circumstance. Take for example a choice between the following two, three-outcome gambles in the domain of gains1
where g = (p1, x1; p2, x2, p3, x3) is the gamble that has a p1 chance of yielding x1, p2 chance of yielding x2, and p3 chance of yielding x3. Thus, each gamble has the same three possible outcomes: either $0, $500, or $1000, but different probabilities of yielding those outcomes. Without loss of generality, we can rescale CPT's value function so that v($0) = 0, v($1000) = 1, and v($500) = v, where 0 < v < 1 depends on the particular form and parameters of value function. Let us assume for this example that v = 0.5. Then, assuming the Prl2 form of the probability weighting function with r = 0.58 and s = 1.18 (blue curve in Figure 2) CPT yields yields U(A) = 0.335 and U(B) = 0.330, so Gamble A is preferred to Gamble B. However, assuming the LinLog form of the probability weighting function with r = 0.60 and s = 0.65 (red curve in Figure 2) yields U(A) = 0.333 and U(B) = 0.335, so Gamble B is preferred to Gamble A, i.e., the preference is reversed. ADO provides a procedure to identify such gamble pairs to present in the next trial of a choice experiment given the current estimate of the parameters.
Is this pair of gambles an anomaly, or are there other stimuli for which these two probability weighting curves imply opposite predictions? To answer this question, we consider the space of all possible gambles on these three fixed outcomes, which is equivalent to the space of all probability triples (p1, p2, p3) such that p1 + p2 + p3 = 1. The latter restriction implies that p2 = 1 – p3 – p1, hence we can geometrically represent these gambles in the unit triangle in the (p1, p3) plane. This representation is commonly known as the Marschack-Machina (MM-) triangle (Marschak, 1950; Machina, 1982). The MM-triangle is essentially a probability simplex with each vertex representing a degenerate gamble that yields one of the three outcomes with certainty (lower right – x1; lower left – x2; top – x3), and each point inside the triangle representing a categorical probability distribution over the three outcomes (i.e., a three-outcome gamble). A pair of gambles is then represented by a line segment joining those two gambles in the MM-triangle.
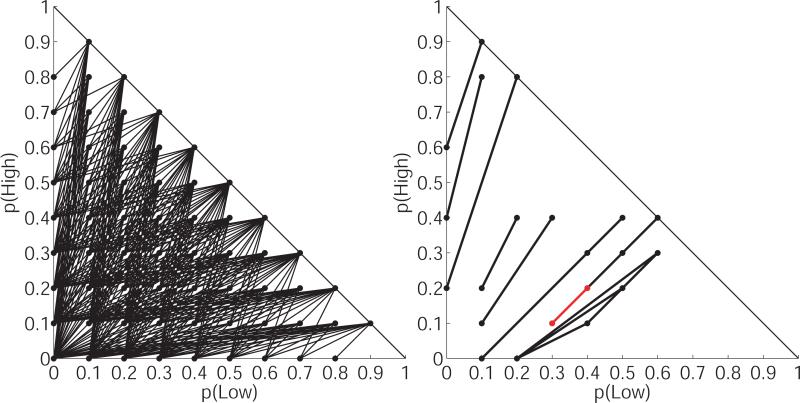
The triangle on the left in Figure 4 depicts the 495 such pairs of gambles that are obtained by rounding all probabilities to the nearest 0.1 and removing those pairs in which one gamble stochastically dominates the other.2 We call this set the ‘choice-stimulus space’ because it is the set of possible pairs of gambles (i.e., choice-stimuli) that might be presented in an experiment. For which of these 495 stimuli do the two weighting functions in Figure 2 imply opposing predictions? If we set v = 0.5 as before, there are 19 such stimuli3, and they are depicted in the triangle on the right in Figure 4. 19 out of 495 is just less than 4%. This means that, even for two probability weighting curves as virtually identical as those depicted in Figure 2, CPT makes opposite predictions on nearly 4% of possible stimuli in the MM-triangle4. If we expand the search to include gambles over more than three outcomes, or vary outcomes as well as probabilities, that proportion could be even higher
Figure 4.
Left - The set of 495 pairs of gambles on three, fixed outcomes. Right - the subset of these pairs on which the two curves in Figure 2 imply opposite choice predictions. The pair highlighted in red is the one described in the illustrative example.
It could be argued that the differences between the utilities of the gambles in each of these pairs is so small that the actual direction of the preference would be undetectable. Indeed, if one were using CPT as a decision aid then it may not be worthwhile to haggle over minuscule differences in utilities, because if the utilities of the gambles in question were so close then it could be argued that the decision maker would be equally well-off with whichever gamble is chosen. However, if the goal of modeling is to predict choices, rather than to prescribe them, then it is important to verify that the model's predictions generalize to new stimuli, other than those on which the model is directly tested. In that respect, this result is troubling for CPT because it means that assuming the wrong form of the probability weighting function can negatively impact the predictive accuracy of CPT across a range of stimuli, even when the curves themselves appear to be identical upon visual inspection.
Having established that different forms of the probability weighting function imply different predictions on a proportion of the stimuli in the MM-triangle, the question that remains is whether these forms can be discriminated empirically. A naive approach to discriminating between Prl2 and LinLog forms of the probability weighting function would be to simply test at each of the 19 decision stimuli that were identified as being diagnostic between the two curves shown in Figure 2. The problem with that approach is that those 19 pairs were derived from specific assumptions about the values of the parameters of each function, as well as the value of the ‘value parameter,’ v. In general, precise parameter estimates are not available a priori; identifying them is part of the reason for doing the experiment in the first place. Without such an assumption, one would need to estimate parameters based on the choices made by participants in the experiment, and it is almost certain that the results would not match the assumed parameter values that yielded those 19 stimuli. With no prior restrictions on the parameters for each function, both have enough flexibility to fit most data patterns equally well.
What is needed for discriminating between these forms empirically is a methodology that hones in on the best parameters for each function while simultaneously testing gamble pairs that maximally discriminate between functions. This is precisely the idea of ADO, as described in the previous section, which combines intelligent querying at each stage with information updating between stages.
It is important to recognize that ADO customizes an experiment to be maximally diagnostic among a prespecified set of models. That is, the ADO experiment is optimized to answer the question of which model among the set is best capable of explaining the data generating process. Any model that is not included in that prespecified set can still be fit to the data after the fact, but the data are likely be less informative for assessing that model because the selection of discriminating designs in ADO did not consider it. For example, an experiment designed to discriminate between Tversky and Kahneman's (1992) weighting function and Prelec's (1998) one-parameter weighting function may reveal Tversky and Kahneman's to be conclusively superior, but the same data would not necessarily be able to discriminate between that function and Prelec's (1998) two-parameter weighting function. While it is desirable to include as many models in the analysis as possible, each additional model adds to the computations that must be carried out throughout the experiment, which can slow the pace of the experiment to such an extent that participants have to wait excessively between trials. Therefore, the number of models that can be considered in a single ADO experiment is limited by hardware and software constraints. At the very least, an ADO experiment with a limited number of models under consideration can be used to narrow the field of candidate models. Thus, a key step in implementing ADO is to decide on an appropriate set of models to be included in the analysis. In the next section, we will describe the models under consideration for our analysis, and the implications of discriminating among them.
3 Functional forms of the models
Among the different functional forms that have been proposed, we focus on five that have received the most attention in the literature. The functional forms are defined as follows:
The simplest possible form is the identity function: w(p) = p. Equipped with this form, CPT reduces to expected utility, hence we refer to it as EU. This form has no free parameters to estimate. The next two forms in the list, TK and Pr11, have one-parameter each, and are attributed to Tversky and Kahneman (1992) and Prelec (1998), respectively. The Prl1 form is derived from three axioms: ‘compound invariance,’ ‘subproportionality,’ and ‘diagonal concavity.’ It was the form favored by Stott (2006). The TK form first appeared in Tversky and Kahneman's original CPT paper and is commonly applied in practical applications of CPT. However, no one appears to have made a normative case for adopting this function. The lower bound on r in the TK form prevents it from becoming non-monotonic, as shown by Ingersoll (2008).
The last two forms in the list have two parameters each. The LinLog form is based on the assumption of a linear relationship between the log of the weighted odds and the log probability odds:
The LinLog form was originally used by used by Goldstein and Einhorn (1987), although not as a probability weighting function. It is a generalization of Karmarkar's one-parameter weighting function (Karmarkar, 1978, 1979), which did not include the intercept parameter s, and is a variant of the form used by Lattimore et al. (1992).
The LinLog function was considered at length by Gonzalez and Wu (1999), who argue for its psychological plausibility in capturing two logically independent properties: discriminability and attractiveness. They also give a simple preference condition that is necessary and sufficient for a linear-in-log-odds relationship. Empirical evidence for a linear-in-log-odds distortion of probability is given by Zhang and Maloney (2012), who consider how probability information is used not just in decision-making but also in a wide variety of cognitive, perceptual, and motor tasks. They find that the distortion of probability in all cases is well-captured as linear transformations of the log odds of frequency.
The other two-parameter form that we consider, Prl2, is a more general form of Prl1 that does not assume the axiom of diagonal concavity. The Prl1 form is obtained as a special case of the Prl2 from by setting the parameter s to unity. Another special case of the Prl2 form is obtained by setting the r parameter to unity, which results in a power law in s. Normative support for using a power curve to represent the probability weighting function is given by Luce et al. (1993), Prelec (1998), and Luce (2001). A more general ‘switch-power’ form of Prl2 with 4 parameters is derived by Diecidue et al. (2009). Other derivations of the Prl2 form from simpler and more easily testable assumptions have been given by Luce (2001), Aczél and Luce (2007), and Al-Nowaihi and Dhami (2006).
The upper bound on the r parameter in the Prl2 form ensures subproportionality throughout [0, 1]. Prelec (1998) also derived a two-parameter form without this restriction. However, while there is only limited empirical evidence about the extent to which subproportionality holds throughout the [0,1] interval, prior empirical studies that have estimated Prl2 parameters have found r < 1 (e.g., Bleichrodt et al., 2001; Goeree et al., 2002; Booij and Van de Kuilen, 2009), so we chose to use the subproportional form in our analysis. This assumption also yields a critical difference between Linlog and Prl2, since LinLog is only mostly subproportional throughout the [0,1] interval, for various combinations of its parameters, whereas Prl2 is everywhere subproportional (Gonzalez and Wu, 1999).
4 Model specification
Because probability weights cannot be measured directly (e.g., by asking a participant for the subjective weight given to a probability), they must be estimated indirectly through observed choices. Therefore, to compare functional forms of the probability weighting function, we must embed each form in the CPT framework. For a three-outcome gamble g = (p1, x1; p2, x2; p3, x3), where x1 < x2 < x3, CPT assigns a utility using the formula
where w(pi) is the probability weighting function and v(xi) is a monotonic value function. Many different functional forms have been suggested for the value function, but as shown in Section 2, we may assume without loss of generality that v(x1) = 0 and v(x3) = 1, yielding the utility function
This simplification leaves one parameter, v = v(Xm) with 0 ≤ v ≤ 1, to characterize the value function, which can be estimated from the data without assuming any particular functional form for v(xi).
The preceding decisions complete the deterministic part of the model. To fit the models to data, we must also account for stochastic variation (i.e., noise; Hey, 2005), which we do by using a variation of the ‘true-and-error’ approach of Birnbaum and Gutierrez (2007) and Birnbaum (2012). In this ’agnostic’ approach, it is assumed that there is a true underlying, preference on each trial, but that the probability of the actual choice being aligned with that preference is between 0.5 and 1. This means that the probability of an “error” on each trial (i.e., choosing the gamble that is not preferred) is between 0 and 0.5. Formally, the probability of an error is captured by a parameter ∊, (0 < ε < 0.5). Since the parameter may take on different values on different trials, it is not estimated from the data, but rather left to be uniformly distributed between 0 and 0.5 on each trial. The idea is to acknowledge the existence of noise while making only minimal assumptions about it's functional form so that the functional form of the probability weighting function can be estimated independently of the functional form of stochastic variation.
Formally, let be the ith gamble pair presented in an experiment, and let θm denote the parameters of the probability weighting function and value function, which determine a weak ordering over Ai and Bi based on their utilities. The probability of choosing gamble is given by
where εi is a random variable between 0.0 and 0.5.
The full, Bayesian specification of each model includes a prior distribution on θm. For parameters that are bounded both above and below, we used a uniform prior on the admissible range. For parameters that are not bounded above (s in Prl2 as well as both r and s in LinLog) we used a uniform prior on [0, 2]. These priors are consistent with previous empirical estimates of the parameters of each form, which easily fall within these ranges (Stott, 2006).
In this way, each functional form of the probability weighting function gives rise to a different CPT model with potentially different choice predictions. To keep the notation simple, we will use the same name to refer to both the probability weighting function and the CPT model that instantiates that form.
5 Simulation Experiments
Before implementing ADO in experiments with people, we conducted computer simulation experiments to test the extent to which ADO could discriminate among functional forms in a controlled environment, i.e., where we know the identity of the data generating model. In each simulation, a “true” model is specified and used to generate data (i.e., choices) at stimuli that were selected by ADO. We say that the models were successfully discriminated if data that were generated over the course of the simulation would allow an uninformed observer (i.e., one who did not know beforehand which model generated the data) to conclusively identify the true model. Formally, each simulation began with uninformative priors5 and equal model probabilities, which were updated after each choice was observed. When an experiment is successful at discriminating the models, we should see the posterior probabilities of all competing models (other than the true model) fall to near zero, leaving the posterior probability of the true model near 1.00. Thus, the goal of the simulation was to determine how quickly the posterior probability of the true model converged to some threshold at which we could say that it was conclusively identified (e.g., probability = 0.99).
As a preliminary check of the algorithm's potential effectiveness in this context, we began with a simple case in which ADO only had to discriminate between two models: EU and TK. This amounts to discriminating between EU and CPT – a problem for which there are already elegant design strategies that work well (e.g., Wu and Gonzalez, 1996). The results of these initial simulations, which can be found in Appendix 1, illustrate the logic of how ADO selects the stimuli, and shows that ADO can indeed work efficiently, even when the data are generated with stochastic error. In addition, they show the designs generated organically by ADO match what has been derived analytically as being diagnostic between EU and CPT. The analysis also shows that, while these designs discriminate well between EU and CPT, they do not discriminate between variations of prospect CPT with different functional forms, suggesting that a more refined set of stimuli is required.
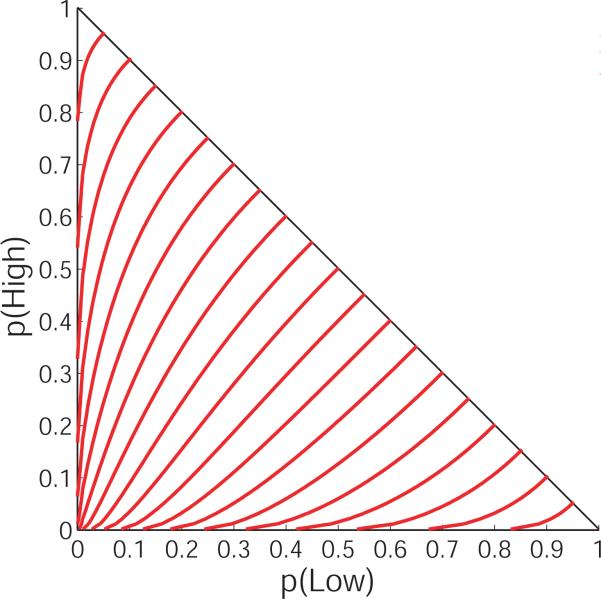
To determine if ADO could identify gamble pairs that could discriminate among multiple variations of prospect theory, we put ADO to the task of discriminating simultaneously between the five variations of CPT defined above. We ran simulations with many different generating models and parameters over the course of the study, but for a representative illustration we will report on the case in which the probability weighting function was LinLog with r = 0.60 and s = 0.65 (i.e., the red curve in Figure 2). We have already seen how closely this particular function can be mimicked by the Prl2 form (Figure 2), so it provides an ideal test of how well ADO can tease apart subtle differences between forms. To round out the generating model, we set v = 0.5, and let the error rate be drawn randomly, independently on each stage, between 0 and 0.5. 6 The level curves of the utility function of CPT with these parameters are shown in Figure 5.
Figure 5.
Level curves of the the data-generating model. The model is CPT, assuming a Linear-in-Log-Odds weighting function with r=0.60, s=0.65 and v=0.5
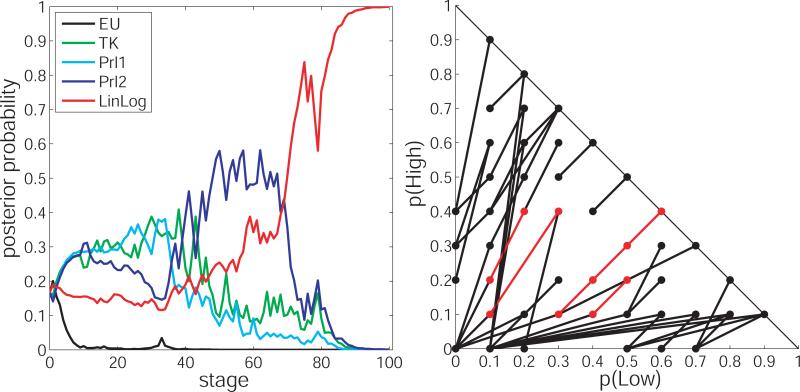
The posterior probability of each model across 100 adaptive trials of the experiment are depicted in the left panel of Figure 6. The posterior probability of LinLog after 100 trials was greater than 0.999, indicating that ADO successfully identified it as the generating model. Besides this success, it is also interesting to note the progression of posterior probabilities across trials. In particular, the graph shows that the one-parameter forms, TK and Prl1, had the highest posterior probability for the first 40 trials. This can be explained by the fact that when the model fits are comparable, Bayesian model selection favors the simpler model (i.e., the one with fewer parameters). That is, if a second parameter is not required to fit the data, the models with two parameter will be penalized for their complexity. After 40 trials, as the adaptive algorithm selects key stimuli, the need for a second parameter becomes apparent and the probabilities of TK and EU begin to drop toward zero. Once it is clear that two parameters are required, ADO selects stimuli that discriminate between the two two-parameter forms, LinLog and Prl2. By stage 70, the posterior probability of the incorrect Prl2 model begins to drop rapidly (modulo stochastic error).
Figure 6.
Results of ADO simulation comparing EU, TK, Prl1, Prl2, and LinLog simulataneously. Left: posterior model probabilities of each candidate model across trials of the simulation. Right: optimal stimuli selected by ADO. Highlighted in red are the stimuli that were also identified in Figure 4 as being diagnostic between the data-generating model and a particular competitor.
The graph on the right in Figure 5 shows the pairs that were selected by ADO to discriminate the models. Highlighted in red are those stimuli that were also identified in Figure 4 as being diagnostic between the generating model and its close competitor, Prl2 with r=0.71, s=1.05, and v=0.71. To force Prl2 to fail, the data must be such that Prl2 can not provide a good fit for any of its parameter values. Therefore, it makes sense to test some of those stimuli that would potentially give Prl2 trouble for those particular parameter values.
At the end of the ADO simulation, the generating model was identified conclusively. However, one might ask: Was the ADO machinery really necessary to achieve this level of model discrimination? Could the same level of model discrimination have been achieved in a comparable number of trials using a fixed design from the literature, or perhaps a design with randomly selected stimuli? To answer that question, we ran two additional simulations. In them, choices were generated from the same model as in the ADO simulation (i.e., LinLog with r = 0.60, s = 0.65, v = 0.5), and model and parameter probabilities were updated after each choice, but stimuli were not optimized using ADO. In the first additional simulation, which we call the ”HILO simulation,” stimuli were the 12 gamble pairs comprising the well-known HILO structure (Figure 7; Chew and Waller, 1986), which is a fixed set of choice-stimuli that has been used to test critical properties of non-expected utility theories (Daniels and Keller, 1990; Wu and Gonzalez, 1998). The HILO simulation was run for 150 trials, at which point at least 12 choices had been simulated at each of the 12 HILO stimuli. In the second additional simulation, which we will call the ”random simulation,” stimuli were drawn at random (with replacement) from the 495 possible gamble pairs depicted in Figure 4. The random simulation was also run for 150 trials, at which point 150 choices had been made at randomly selected stimuli from the triangle.
Figure 7.
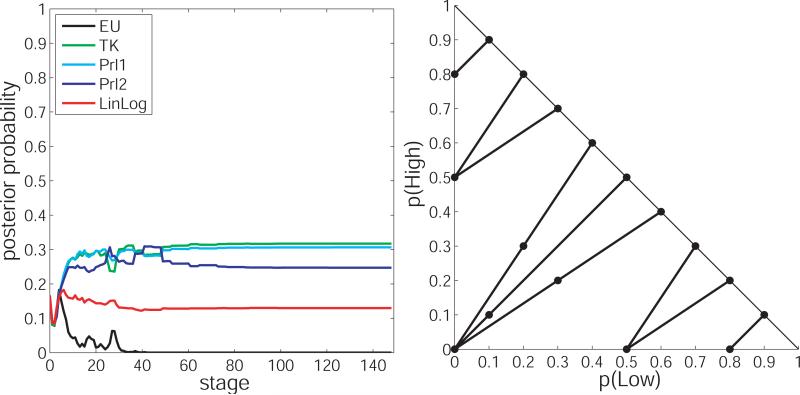
Results of the “HILO simulation.” Left: posterior model probabilities of each candidate model across trials of the simulation. Right: HILO stimuli on which choices were generated in the simulation.
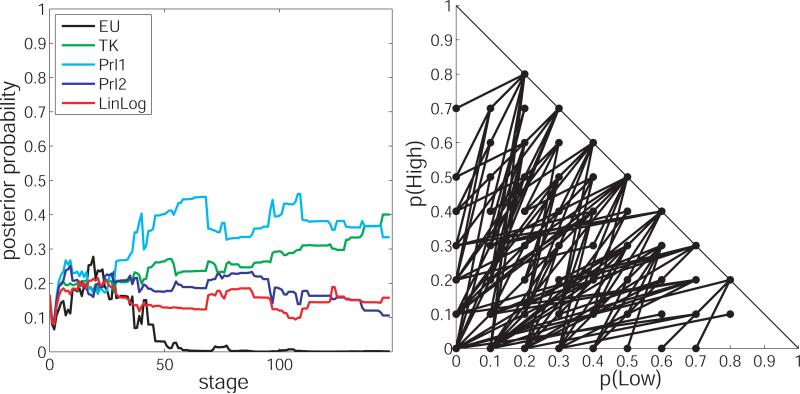
As can be seen in the left graphs of Figures 6 and 7, neither the HILO simulation nor the Random simulation correctly identified the data generating model. In fact, in both cases, the models with the highest posterior probabilities were the one-parameter forms: TK and Prl1. This may be because all of the CPT models (except for EU), could fit the observed choices equally well, hence the simpler models were favored. What is more, judging by the progressions of the posterior probabilities across trials, it does not seem that the correct model would have been identified any time soon had the experiment continued past 150 trials. In particular, in the HILO simulation, it seems that after about 60 trials (5 simulated choices at each of the 12 stimuli), everything that could be learned about the generating model by testing at the HILO stimuli had already been learned.7 To better identify the generating model would require testing at different stimuli. On the opposite extreme, in the random simulation, choices were simulated at 132 different stimuli over the course of the experiment. However, this variety did not improve identification of the generating model. Of course, if the random simulation were allowed to continue indefinitely then all 495 questions would eventually be asked enough times to discriminate the models, but this could take on the order of thousands of trials. The similarity between the progression of posterior probabilities across 150 stages in the random simulation (Figure 7) and the progression of posterior probabilities across the first 30 trials of the ADO simulation (Figure 5) suggests that the ADO simulation is generating the same information as the random simulation, but at a much faster rate.
These simulation results suggest that testing heavily at a small, fixed set of stimuli does not necessarily identify the generating model, nor does testing lightly at a wide, but unprincipled set of stimuli. Rather, efficiently identifying the generating model requires focused testing at the stimuli that are maximally informative, as is accomplished with ADO.
6 Experiment results and analysis
Having demonstrated the ability of ADO to discriminate among probability weighting functions in simulations, even amidst stochastic error, we turned to evaluating its effectiveness in doing so with human participants. The setup was identical to that of the simulation experiments, except that choices were made by human subjects instead of being simulated by the computer. Nineteen subjects (undergraduate and graduate students from The Ohio State University) made 101 choices over the course of 60 minutes.
As in the simulations, stimuli were selected by ADO from the grid of 495 gamble-pairs in the MM-triangle depicted in Figure 4, where the three possible outcomes of each gamble were $25, $350, and $1000. In principle, any three dollar values could have been used, but these particular dollar values were selected so that the v parameter would be likely to be somewhere near the middle of it's admissible range (e.g., around 0.5), and so that the expected values of the gambles would not be too transparent (as they would be if the values were $0, $500, and $1000, for example). All gambles were hypothetical and each participant was paid $10 at the end of the experiment. Gambles were presented on the computer screen with outcomes and probabilities in text format, as shown in Figure 9. There was a lag time of up to 30 seconds between trials during which the gambles were masked while posterior probabilities were calculated and the next choice stimulus was found by the ADO algorithm.
Figure 9.
Screen shot of the GUI for the experiment.
Also as in the simulations, models were compared based on their full posterior probabilities. However, unlike in the simulations, there was no ‘true’ model in this case, so the goal of each experiment was to identify one form as being superior (e.g., posterior probability greater than 0.76, the equivalent of a Bayes factor of at least 3.2) which was inferred to be the participant's underlying model of decision making in this task.
For each participant, the favored model and its posterior probability at the conclusion of the experiment are shown is shown in Table 1. The posterior probabilities can be interpreted according to the rule-of-thumb guidelines of Jeffreys (1961). Specifically, a posterior probability higher than 0.76 is considered “substantial” evidence, a posterior probability higher than 0.91 is considered “strong” evidence, and a posterior probability greater than 0.99 is considered “decisive” evidence.8 In Table 1, the level of evidence exceeded 0.76 in all but two cases. In all but four cases the level of evidence exceeded 0.91, and in 11 out of 19 cases the level of evidence exceeded 0.999.
Table 1.
Model with the highest posterior probability at the conclusion of the each experiment.
| Participant ID | Best model | Posterior probability |
|---|---|---|
| 1 | LinLog | 0.97 |
| 2 | Prl2 | 0.99 |
| 3 | Prl1 | 0.92 |
| 4 | Prl2 | 0.99 |
| 5 | LinLog | 0.99 |
| 6 | LinLog | 0.99 |
| 7 | LinLog | 0.99 |
| 8 | Prl2 | 0.99 |
| 9 | EU | 0.85 |
| 10 | LinLog | 0.99 |
| 11 | Prl2 | 0.99 |
| 12 | Prl2 | 0.98 |
| 13 | EU | 0.92 |
| 14 | LinLog | 0.57 |
| 15 | Prl2 | 0.56 |
| 16 | Prl2 | 0.99 |
| 17 | Prl2 | 0.99 |
| 18 | LinLog | 0.80 |
| 19 | Prl2 | 0.99 |
The posterior model probabilities give the relative likelihood of each functional form, but they do not indicate how well, or how poorly, the models are fitting overall, which is a key element of prediction, the ultimate goal of modeling behavior. One way to assess absolute fit is to compute the maximum proportion of the observed choices that each model can correctly predict (maximized over parameter values). A model that fits well should be able to correctly predict a large proportion of the choices (but not all of them because of stochastic error)10. For each model, this maximum was found via a grid search of its parameter space, and the results are shown in Table 2. The average maximum proportion of correct predictions for EU, TK, Prl1, Prl2, and LinLog were 0.61, 0.67, 0.66, 0.76, and 0.75, respectively. When evaluating these proportions, it is worth noting that they came from stimuli that were specifically tailored to put maximal pressure on each model to fail. This means that there were no “easy” stimuli would allow all of the models to perform well. Thus, it is not surprising to see relatively low proportions of correct responses.
Table 2.
Maximum proportion of choices predicted correctly by each model.
| Subject | EU | TK | Prl1 | Prl2 | LinLog |
|---|---|---|---|---|---|
| 1 | 0.59 | 0.70 | 0.66 | 0.75 | 0.80 |
| 2 | 0.62 | 0.62 | 0.63 | 0.79 | 0.73 |
| 3 | 0.62 | 0.75 | 0.81 | 0.81 | 0.78 |
| 4 | 0.63 | 0.63 | 0.64 | 0.76 | 0.71 |
| 5 | 0.62 | 0.67 | 0.64 | 0.68 | 0.75 |
| 6 | 0.60 | 0.60 | 0.60 | 0.70 | 0.81 |
| 7 | 0.57 | 0.59 | 0.60 | 0.73 | 0.82 |
| 8 | 0.61 | 0.68 | 0.69 | 0.80 | 0.75 |
| 9 | 0.69 | 0.70 | 0.70 | 0.70 | 0.70 |
| 10 | 0.57 | 0.59 | 0.59 | 0.67 | 0.73 |
| 11 | 0.55 | 0.63 | 0.58 | 0.79 | 0.72 |
| 12 | 0.56 | 0.69 | 0.68 | 0.75 | 0.74 |
| 13 | 0.71 | 0.71 | 0.71 | 0.71 | 0.72 |
| 14 | 0.58 | 0.74 | 0.70 | 0.72 | 0.76 |
| 15 | 0.59 | 0.66 | 0.67 | 0.72 | 0.72 |
| 16 | 0.61 | 0.63 | 0.63 | 0.77 | 0.70 |
| 17 | 0.60 | 0.77 | 0.64 | 0.84 | 0.74 |
| 18 | 0.62 | 0.78 | 0.79 | 0.84 | 0.88 |
| 19 | 0.55 | 0.59 | 0.61 | 0.87 | 0.73 |
| Average | 0.61 | 0.67 | 0.66 | 0.76 | 0.75 |
To provide a second opinion on the model selection results based on posterior probabilities, we report the Akaike Information Criterion (AIC; Akaike, 1973) for each model and participant in Table 3. The AIC is computed as AIC = –2 ln L + 2k, where ln L is the maximized log-likelihood (computed from the maximum number of correct responses) and k is the number of free parameters in the model. Like the posterior model probability, the AIC is a model selection measure that trades off fit and complexity, but rather than being interpreted as a likelihood of the model being true, the AIC is interpreted as an information-theoretic distance between the true model and the fitted model (Myung, 2000). In the model selection literature, it is well-known that the posterior probability tends to favor simple models, whereas the AIC tends to favor complex models (Kass and Raftery, 1995). Therefore, if the two measures select the same model then one can be reasonably confident that the decision was not overly dependent on the assumed prior (Liu and Aitkin, 2008).
Table 3.
AIC of each model, for each participant
| Participant ID | EU | TK | Prl1 | Prl2 | LinLog |
|---|---|---|---|---|---|
| 1 | 150.2 | 128.0 | 136.8 | 119.0 | 108.1 |
| 2 | 143.6 | 145.6 | 143.4 | 110.3 | 123.4 |
| 3 | 143.6 | 117.0 | 103.9 | 105.9 | 112.5 |
| 4 | 141.4 | 143.4 | 141.2 | 116.8 | 127.8 |
| 5 | 143.6 | 134.6 | 141.2 | 134.4 | 119.0 |
| 6 | 148.0 | 150.0 | 150.0 | 130.0 | 105.9 |
| 7 | 154.6 | 152.2 | 150.0 | 123.4 | 103.7 |
| 8 | 145.8 | 132.4 | 130.2 | 108.1 | 119.0 |
| 9 | 128.2 | 128.0 | 128.0 | 130.0 | 130.0 |
| 10 | 154.6 | 152.2 | 152.2 | 136.6 | 123.4 |
| 11 | 159.0 | 143.4 | 154.4 | 110.3 | 125.6 |
| 12 | 156.8 | 130.2 | 132.4 | 119.0 | 121.2 |
| 13 | 123.8 | 125.8 | 125.8 | 127.8 | 125.6 |
| 14 | 152.4 | 119.2 | 128.0 | 125.6 | 116.8 |
| 15 | 150.2 | 136.8 | 134.6 | 125.6 | 125.6 |
| 16 | 145.8 | 143.4 | 143.4 | 114.6 | 130.0 |
| 17 | 148.0 | 112.6 | 141.2 | 99.3 | 121.2 |
| 18 | 143.6 | 110.5 | 108.3 | 99.3 | 90.5 |
| 19 | 159.0 | 152.2 | 147.8 | 92.7 | 123.4 |
As a baseline for comparison in interpreting the AIC results in Table 3, a model that provided no information would assign a 0.5 chance to each pairwise choice and the resulting AIC would be 140.02. It is notable then that EU, TK and Prl1 frequently have AIC values higher than 140.02 in Table 3, indicating that they provide no useful information about the participant's decision making in this task. This can be attributed to the fact that ADO selected stimuli that highlighted the weaknesses in these models’ abilities to fit the participant data. For all participants except for one (participant 9) the model with the lowest AIC was also the model with highest posterior probability.
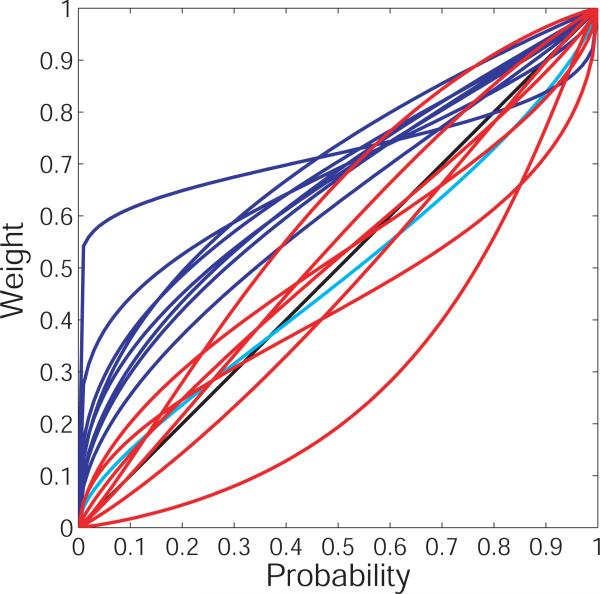
Although the posterior probability and AIC analyses agreed on the best model for each participant, the experiment did not yield a consensus for which model is best across a strong majority of participants. We found Prl2 was favored in 9 cases, LinLog in 7 cases, EU in 2 cases, and Prelec-1 in one case. The Tversky-Kahneman form was never preferred. Figure 10 shows an overlay of the the most probable functional form for each participant, at a parameter setting that maximizes it's fit (note that these parameter settings are not unique). Each curves is color-coded according to which form it is. This figure indicates that the Prl2 form is best for highly elevated curves (i.e., for those who find gambles attactive), but that the Linear-in-Log-Odds form is best everywhere else. Most of the curves are inverse-sigmoid shaped, but many participants had highly elevated weighting functions, which indicates that a participant finds betting on the chance domain attractive (Gonzalez and Wu, 1999).
Figure 10.
Estimates of the probability weighting curve for each participant, obtained by a grid search of the parameter space of the model with the highest posterior probability. Curves are color-coded by their functional form: Blue = Prelec-2, Red = LinLog, Light blue = Prelec 1, Black = EU. It should be noted that the depicted curves are not unique, as various combinations of parameter settings yield the same proportion of correct predictions for each model.
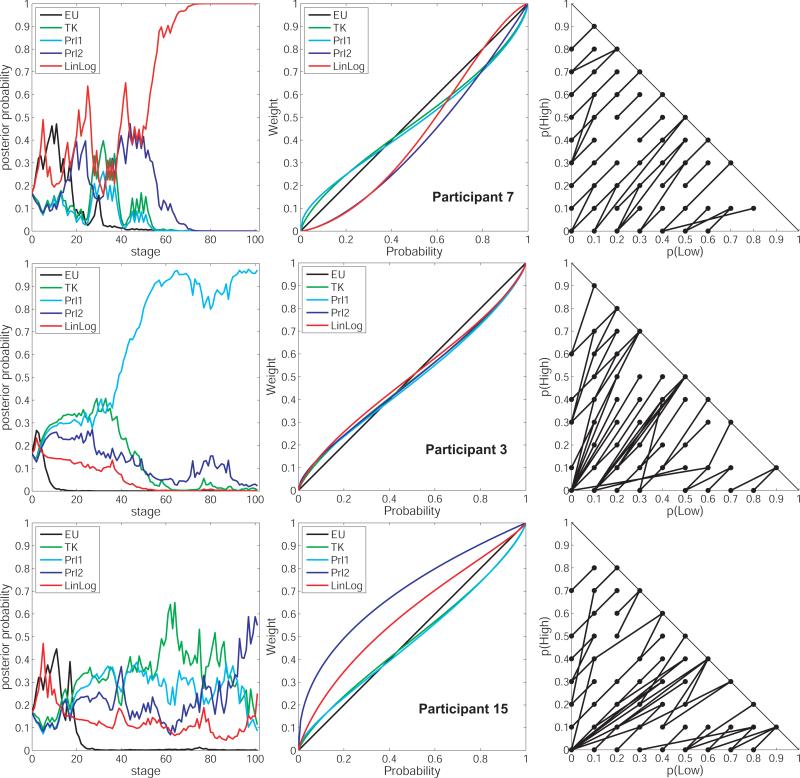
Further analyses probed these individual differences and highlighted the advantages of the ADO procedure in testing models of risky decision making. Figure 11 shows more specific, individual-level results for three participants: 7, 3, and 15. First, on the left of Figure 11 are graphs of the progression of posterior model probabilities across trials. These progressions show that the method worked as advertised for participants 3 and 7, discriminating between models unambiguously. For both participants, the posterior probability of one model (LinLog for 7 and Prl1 for 3) exceeded 0.76 by about 50 trials, and remained above 0.76 through the conclusion of the experiment. The other participant, 15, is an example in which the methodology failed to yield a conclusive result; the progression of posterior probabilities is noisy and no model reaches the threshold of 0.76 at any time during the experiment, even though the AIC results indicate that the Prl2 and LinLog models both fit the data reasonably well in the end.
Figure 11.
Detailed results for three participants. In each row, the graph on the left depicts the progression of posterior model probabilities across trials, the graph in the middle depicts the best estimate of each model at the conclusion of the experiment, and the MM-Triangle on the right depicts the stimuli on which choices were made over the course of the experiment.
Continuing with the analysis of Figure 11, in the middle column are estimates of the best probability weighting curve of each form, for each of the three participants. All of the estimates for participant 3 have the characteristic inverse-sigmoid shape that is reported in most previous studies. However the estimates of Prl2 and LinLog for participant 7 are sigmoid shaped, underweighting small probabilities and underweighting large ones. This shape is reported less frequently in previous studies, but is not unprecedented (e.g., Jullien and Salanié, 2000; Goeree et al., 2002; Van de Kuilen et al., 2009). Thus it appears that superiority of LinLog for participant 7 is due at least in part to its ability to become sigmoid-shaped (which TK and Prl1 cannot). In contrast, the estimates for participant 15 are highly elevated and concave, indicating that this participant found the chance domain attractive. Finally, depicted inside the MM-triangles in the right column of Figure 11 are the stimuli presented to each participant. Comparison of the triangles shows that the optimal set of stimuli was different for each participant, which is to be expected given how differently each participant weighted probabilities.
6.1 Why did some of the models fail?
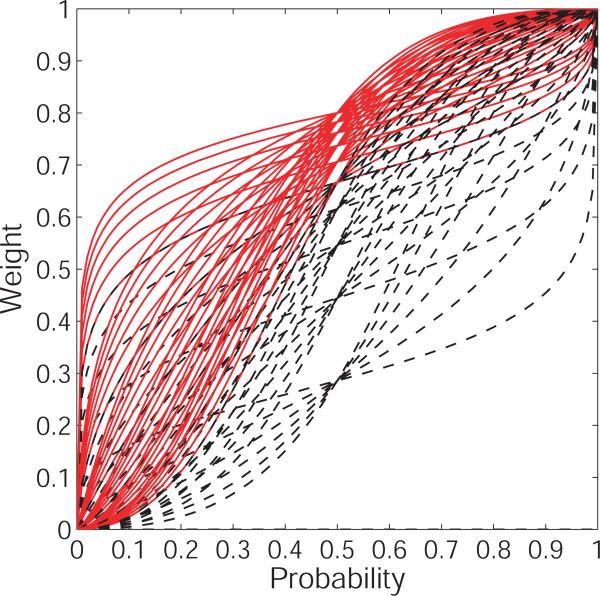
When a model fails, it is helpful to know the reasons for the failure. A closer examination of the parameter estimates for each participant helps to shed light on why some of the models failed in each case. First, we'll consider the participants for whom Prl2 was favored over LinLog based on posterior probability. For six of these seven participants (2, 4, 11, 12, 16, 17, and 19) the inferior LinLog form achieved its best fit to the data (highest proportion of correct predictions) with s = 2, which was the highest value of s with support in the prior. This consistency at the highest value possible suggests that extending the range of s could have yielded better fits. Recall that the s parameter controls the elevation of the probability weighting function, so a high value of s indicates a tendency to overweight probabilities (Gonzalez and Wu, 1999). This overweighting can be seen in Figure 12, which shows how the family of LinLog functions changes when s is increased to be in the interval (2, 4] (with r still in the (0, 2] interval). By reanalyzing the data with the prior on the s parameter of LinLog set to be uniform on [0, 4] instead of on [0, 2] (i.e., allowing the LinLog form to become more elevated) the posterior probability of LinLog increased. In fact, for each of these 7 participants, the LinLog model with s > 2 can correctly predict about the same proportion of choices as Prl2, as shown in Table 4. This comes as a surprise, since no study in the literature has reported such extreme overweighting of probabilities (Stott, 2006; Booij and Van de Kuilen, 2009).
Figure 12.
A uniform sample of LinLog curves from r ∈ (0, 2] and s ∈ (0, 4]. Dotted curves have s ∈ (0, 2]. Solid curves have s ∈ (2, 4].
Table 4.
Comparison of the maximum proportions of choices predicted correctly by LinLog for (s < 2) and for (s > 2).
| Subject | LinLog (s < 2) | LinLog (s > 2) | Prl2 |
|---|---|---|---|
| 2 | 0.73 | 0.78 | 0.79 |
| 4 | 0.71 | 0.75 | 0.76 |
| 11 | 0.72 | 0.80 | 0.79 |
| 12 | 0.74 | 0.76 | 0.75 |
| 16 | 0.70 | 0.76 | 0.77 |
| 17 | 0.74 | 0.80 | 0.84 |
| 19 | 0.73 | 0.86 | 0.87 |
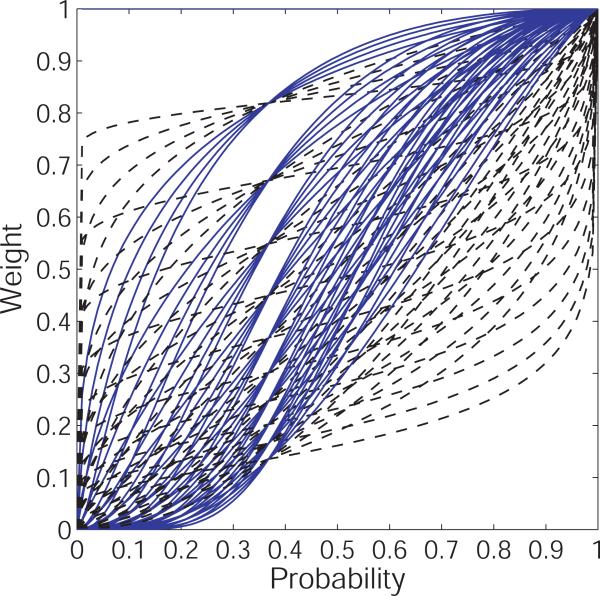
Of the remaining 12 participants, 7 were best fit by LinLog. A closer analysis of the posterior parameter estimates reveals a possible reason for the failure of Prl2 in 4 of these cases: The assumption of subproportionality by Prl2 (i.e., r ≤ 1) is too restrictive. Subproportionality means that, for a fixed ratio of probabilities, the ratio of the corresponding probability weights is closer to unity when the probabilities are low than when they are high. Intuitively speaking, subproportionality means that scaling down the original probabilities makes them less distinguishable from each other (Kahneman and Tversky, 1979; Epper et al., 2011). Subproportionality of the Prl2 form depends on the value of the r parameter: if r ∈ (0, 1] then it is subproportional, if r > 1 then it is not. So far we have only considered the subproportional form of Prl2. However, the fit of Prl2 is improved for participants 5, 7, 8, and 10 when r is allowed to be greater than 1. The maximum proportions of correct responses for subproportional Prl2 ((r ∈ (0, 1]), nonsubproportional Prl2 (r > 1), and LinLog, for participants 5, 7, 8, and 10, are given in Table 5. These results show that when the Prl2 function is freed of the restriction that it must be subproportional, its fits become comparable to those of LinLog. This suggests that subproportionality of the probability weighting function may be an unnecessary and possibly an invalid assumption at the individual level. Use of the ADO procedure contributed to identifying this critical property, subproportionality, that distinguishes the Prl2 and LinLog weighting functions (Gonzalez and Wu, 1999).
Table 5.
Comparison of the maximum proportions of choices predicted correctly by Prl2 under the assumption of subproportionality (r < 1), and without the assumption of subproportionality (r > 1).
| Subject | Prl2 (r ≤ 1) | Prl2 (r > 1) | LinLog |
|---|---|---|---|
| 5 | 0.68 | 0.77 | 0.75 |
| 7 | 0.73 | 0.80 | 0.82 |
| 8 | 0.80 | 0.83 | 0.75 |
| 10 | 0.67 | 0.69 | 0.73 |
7 Discussion and conclusion
Probability weighting functions relate objective probabilities to their subjective weights, and they play a central role in modeling choices under risk with CPT. Equipped with a parametric form of the probability weighting function, CPT makes precise statements about the predicted preferences between pairs of gambles. However, the accuracy of CPT's predictions depends on the level precision with which probability weights can be estimated. This in turn depends on specific assumptions about the parametric form of the probability weighting function. Therefore, identifying the best parametric form of the probability weighting function can improve the effectiveness of CPT in describing decision making under risk.
Several forms of the probability weighting function have been proposed, and their qualitative similarities belie important theoretical differences. While discriminating among them can enhance our understanding of probability weighting in human decision making, the potential for forms to mimic one another pushes the limits of our ability to discriminate among models. Measures of model fit such as r2, which focus only on the shape of the probability weighting curve, are not sensitive to the preference reversals that can result from seemingly small changes to the shape of the probability weighting curve. Even the more sophisticated model selection statistics like the AIC and BIC can not help if data are not collected at stimuli in which the qualitatively similar curves imply different choices. In this paper, we used ADO to specifically target stimuli in the MM-Triangle on which these preference reversals are likely, and thereby investigate the extent to which it is possible to discriminate among forms with choice data.
In simulation experiments, we found that ADO was able to leverage differences between the predicted preference patterns of each form in the MM-Triangle to conclusively identify the data-generating form. Analyses of the stimuli that were selected by ADO highlight important lessons about empirically discriminating among probability weighting functions. In particular, the ADO simulation results suggest that discriminating among forms requires a large and diverse set of stimuli. Repeated testing on the same, uninformative stimuli does not improve discriminability, so standard experimental designs from the literature, such as HILO, are unlikely to be effective in most cases. On the other hand, simply testing on a wide variety of stimuli does not necessarily discriminate the models either. It seems that varied stimuli are needed to pin down the specific predictions of each form, but repeated testing on the stimuli at which the predictions differ is what finally discriminates them. The locations of these critical stimuli differ depending on which forms are under consideration, as well as on the risk preferences of the individual being tested. As a result, there is no one-size-fits-all design that will discriminate among all forms for all participants.
In human experiments we found that the two-parameter forms of the probability weighting function (Prl2 and LinLog) provide the best explanation of human data at the individual level. However, there was heterogeneity in the best two-parameter form; some participants are best described by a Linear-in-Log-Odds weighting function while others are best described by a Prelec-2 form. In general, we found that the Prelec-2 form was best for participants who tended to drastically overweight probabilities. The failure of the Linear-in-Log-Odds form for these participants was due to it's tendency to predict only moderate over-weighting or under-weighting for the parameter range that was considered. For participants who did not drastically overweight probabilities, the Linear-in-Log-Odds form was favored most often, aside from two participants who seemed to be expected utility maximizers.
For several participants, the failure of the Prelec-2 form could be attributed to its assumption of subproportionality. A probability weighting function is subproportional if and only if w(p) is convex in log(p) (Kahneman and Tversky, 1979). Subproportionality is a strong assumption, as it implies that common ratio violations will be observed at all probabilities (Prelec, 1998). It was used by Kahneman and Tversky (1979) to explain the common-ratio effect, and it has been used in connection with the theory of temporal discounting to explain the common difference effect (Baucells and Heukamp, 2009) and to derive a hyperbolic form of utility discounting curves (Epper et al., 2011). However, there is limited evidence on the extent to which subproportionality actually holds (Gonzalez and Wu, 1999). The present results suggest that a functional form that implies everywhere subproportionality is unlikely to provide an adequate explanation of the probability weighting behavior of some participants. Future research should further investigate the extent to which subproportionality holds in the population.
Perhaps the most successful aspect of the human experiment was the unprecedented level of discrimination between one- and two-parameter forms, which resulted from testing stimuli that highlighted differences in their data-fitting capabilities. One such difference is that the one-parameter forms (TK, Prl1) have a fixed elevation and vary only in curvature, whereas the two-parameter forms (PRl2, LinLog) vary independently in both elevation and curvature (see Figure 1). Because the one-parameter forms are limited in their abilities to change elevation, excessive over-weighting or underweighting of probabilities effectively rules them out in favor of the two-parameter forms. Therefore, the heterogeneity that we found in both elevation and curvature of the individual weighting curves indicates that at least two parameters are required to fit them adequately. This is likely a difference that ADO identified and exploited across trials.
The individual differences that we found suggest that a hierarchical Bayesian approach, such as that of Nilsson et al. (2011), may be the most appropriate way to fit group data using a single model. Hierarchical methods capture individual differences by assuming that individual parameter estimates come from a group-level distribution with estimated mean and standard deviation (Conte et al., 2011). This allows the estimation of a particular individual's parameter to draw strength from information that is available about other individuals. While this approach relies on additional assumptions about the distribution of parameters at the group level, it provides an attractive compromise between the extremes of complete pooling and complete independence of individual data (Shiffrin et al., 2008).
The ADO methodology could be further optimized by manipulating additional aspects of the experiments. Recall that only the probabilities that were assigned to the payoffs changed across trials, which remained fixed at $25, $350, and $1000. Although ADO was able to find enough differences in model predictions across the design space (MM-triangle) to differentiate models by manipulating only probabilities, the payoffs could have been manipulated simultaneously, which might have increased the discriminability of the models even further. Such a change in the design might also increase the realism of the experiment. It is therefore advisable that the current results be replicated in other testing situations to ensure their generalizability.
Other manipulations that could influence performance include making the payoff amounts real rather than imaginary and representing the amounts in cents instead of dollars (Furlong and Opfer, 2009). Although these variables could affect model choice, they can pose challenges to incorporate into the ADO algorithm, which requires variables to be expressed explicitly in the model in a computational form. This is not always possible, and as a result, ADO is not always an option in experimentation. Nevertheless, when it is an option, it can be very effective, as was demonstrated here. Of course, this does not mean that ADO will always succeed. The models themselves must be discriminable, as shown through simulation experiments, for ADO to stand a chance of working in practice in an actual experiment with participants.
These experiments considered five different forms of the probability weighting function, each of which has been advocated in the recent literature based on fits to human data: EU (as stochastic expected utility, Blavatskyy, 2007), TK (e.g., Nilsson et al., 2011), Prl1 (Stott, 2006), Prl2 and LinLog (e.g., Booij and Van de Kuilen, 2009). Future research should consider other, more complex functional forms, such as the four-parameter “switch-power” function proposed by Diecidue et al. (2009). Due to the computational demands of ADO, and the need to minimize participant idle time between trials, it was not feasible to consider forms with more than two parameters in this study. However, improvements in hardware and more efficient programming should make the inclusion of such forms possible in the near future. The ADO method can easily be extended to include such forms, as well as different error models, and other models outside the scope of CPT. The ability to tailor the stimuli in a participant's experiment to test error models and different models of decision making may be the strongest advantage ADO has over existing methods.
Figure 8.
Results of the “Random simulation.” Left: posterior model probabilities of each candidate model across trials of the simulation. Right: Stimuli on which choices were generated in the simulation.
Figure 13.
A uniform sample of Prl2 curves for r ∈ (0, 2] and s (0, ∈ 2]. The dotted curves are subproportional (r ∈ (0, 1]). The solid curves are not subproportional (r ∈ (1, 2]).
8 Appendix
8.1 Preliminary simulations
The purpose of the following set of simulations is to illustrate the logic of ADO in a simple case, i.e., a case in which it is easy to see why some stimuli are more diagnostic than others. The simple case is discriminating just EU and TK. This case is an ideal starting point because there is already an established body of knowledge about which designs work well for discriminating between these models, which provides a natural benchmark against which to compare the results of the simulations using ADO.
We will present the results of three simulations. In the first two, the data will be generated without stochastic error. This will allow us to focus on the logic of ADO's selection of stimuli, and to compare the stimuli selected by ADO to those that have been identified in the literature as being diagnostic between EU and TK. In the third simulation, the data will be generated with stochastic error, so we can see how errors in the choice process affect ADO's selection of stimuli, and it's identification of the data-generating the true model.
8.1.1 Simulation 1: Data generated from TK without stochastic error
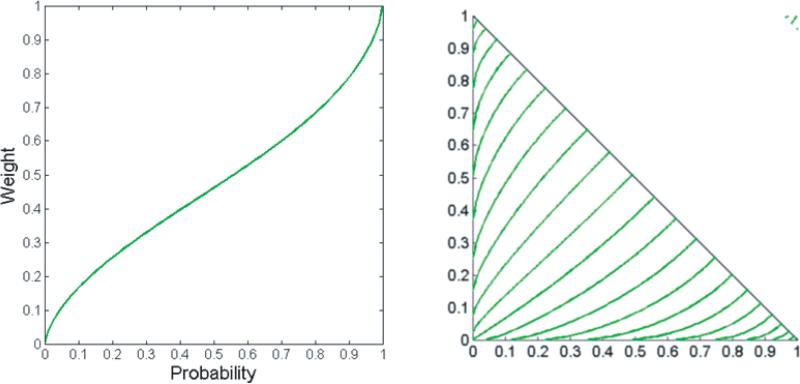
In the first simulation, data were generated from TK with v = 0.5 and r = 0.71. The TK probability weighting function with r = 0.71 is depicted on the left side of Figure 14. The level curves of the CPT utility function in the Triangle, with this particular probability weighting function and v = 0.5, are depicted on the right side of Figure 14.
Figure 14.
Data generating model in simulation 1. On the left is the TK probability weighting curve with r = 0.71. On the right are the indifference curves in the MM-triangle implied by CPT with the probability weighting function depicted on the left, and v = 0.5.
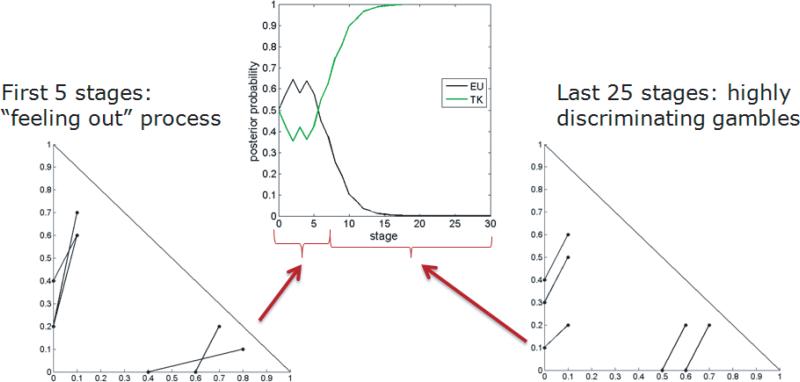
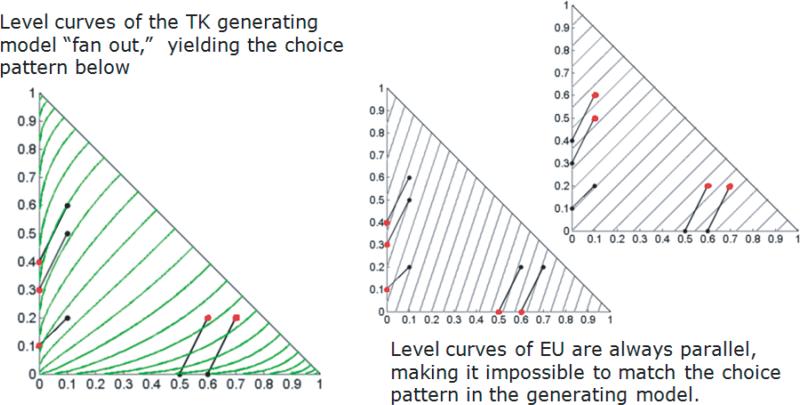
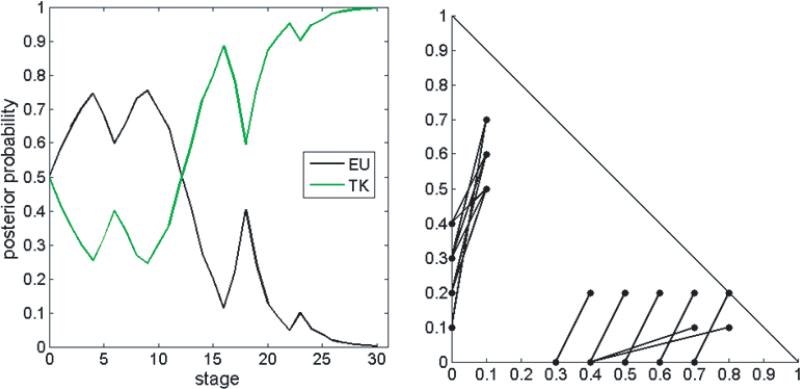
The posterior probabilities of EU and TK across 30 trials of the experiment, and the gamble pairs selected by ADO, are depicted in Figure 15. Figure 16 shows why the stimuli selected by ADO are optimal for discriminating the generating model (TK) from its competitor (EU). Essentially, ADO has automatically identified stimuli that force the indifference curves to “fan out,” increasing in steepness from right to left.
Figure 15.
Results of simulation 1, in which the generating model was TK(0.5,0.71).
Figure 16.
Graphical depiction of reason why the stimuli selected by ADO are optimal for discriminating TK from EU.
8.1.2 Data generated from EU without stochastic error
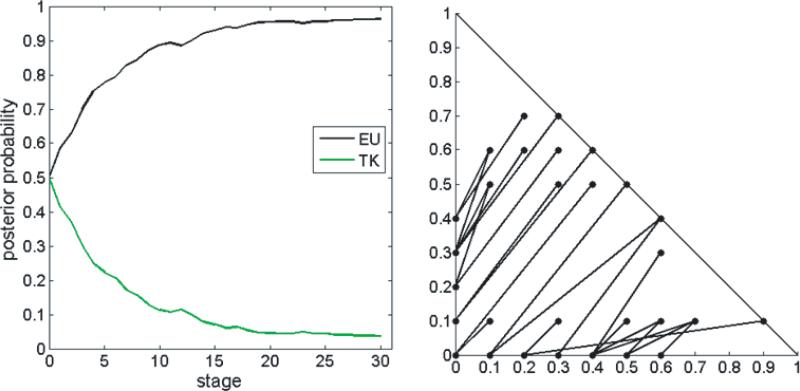
In the second simulation, data were generated from EU with v = 0.5. The posterior probabilities of EU and TK across 30 trials of the experiment, and the gamble pairs selected by ADO, are depicted in Figure 17. These stimuli are different than those identified in Simulation 1, which shows that the optimal stimuli depend on the data generating model. In this case, ADO is essentially testing to see if the indifference curves are really parallel across the entire MM-Triangle.
Figure 17.
Results of simulation 2, in which the generating model was EU(0.5). EU is quickly and correctly identified as the generating model (Left) based on testing at the stimuli selected by ADO (right).
8.1.3 Simulation 2: Data generated from TK with stochastic error
In the third simulation, data were generated from TK with v = 0.5 and r = 0.71 and a constant stochastic error rate of 0.25. That is, on each choice instance, there was a 25% chance that the generated choice would be the opposite of that predicted by the true model. The posterior probabilities of EU and TK across 30 trials of the experiment, and the gamble pairs selected by ADO, are depicted in Figure 18. We see the same pattern of stimuli, but with more variation. The posterior model probability still converges, but not as quickly, and not monotonically.
Figure 18.
Results of Simulation 3, in which the generating model was TK(0.5,0.71) with a stochastic error rate of 0.25. Posterior model probabilities (left) are noisy but strongly favor TK by stage 30. Stimuli selected by ADO (right) resemble those selected in the noiseless case (simulation 1, Figure 15), with more variation, corresponding to the longer ”feeling out” period resulting from the noisy data stream.
8.1.4 Summary of preliminary simulations
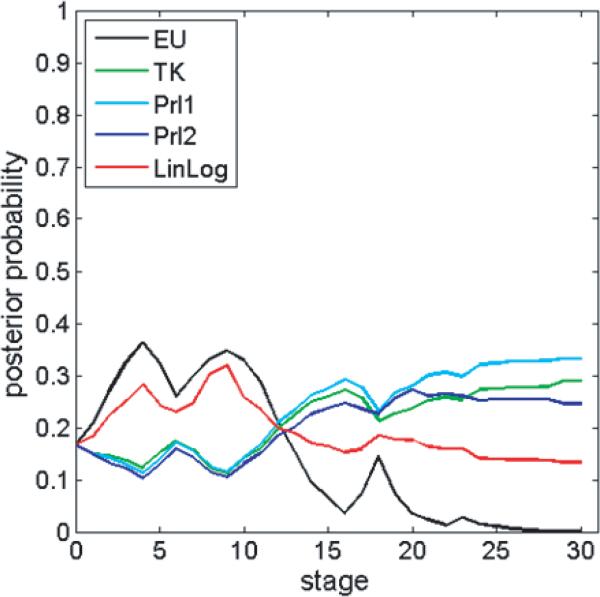
In the preceding, three simulations, ADO successfully discriminated between EU and TK forms of the probability weighting function. But what about the other functional forms: Prl1, Prl2, and LinLog? Would the choice data from these simulations also identify the generating model from among this larger class of candidates? To answer that question, we can restart the simulations with equal prior probabilities of each of those five candidate models, and uniform paramaeter priors for each model, and then update them based on the same data stream from the preceding simulations (i.e., the same choices at the same stimuli). The resulting progression of posterior probabilities from simulation 3 is shown in Figure 19. Even after all 30 trials are complete, the posterior probability of TK (the true generating model) is only 0.29, indicating that the generating model has not been identified. Figure 19 suggests that a more refined set of stimuli may be required to discriminate among a larger set of possible functional forms.
Figure 19.
Posterior probabilities of EU, TK, Prl1, Prl2, and LinLog based on the data from Simulation 3. Stimuli were optimized to discriminate only EU and TK. The data clearly discriminate TK from EU, but not from the other models, suggesting that a more specialized set of stimuli is required to discriminate the larger set of models.
Footnotes
CPT allows for different decision weights for gains and losses. In this study, we focus only on gains in order to simplify the analysis and focus more precisely on probability weighting. The extension to the case of losses and mixed gambles is straightforward.
CPT always satisfies stochastic dominance, so presenting stochastically dominated stimuli would not help to discriminate between functional forms of CPT. However, in principle, this restriction of the choice-stimulus space could be relaxed to compare other models that do not satisfy stochastic dominance.
Discriminating stimuli were identified by computing the utility of each gamble, under each weighting function, with the specified parameters. The utilities can then be used to generate two vectors of predicted choices across all stimuli, one for each weighting function. Comparing the two vectors reveals the stimuli on which the predicted choices differ.
This estimate counts stimuli only in the MM-triangle with probabilities rounded to the nearest 0.1. Rounding to the nearest 0.05 instead of 0.1 yields a similar estimate, with 201 out of 5940 stimuli discriminating between the two weighting functions depicted in Figure 2.
All parameter priors were uniform on their permissible ranges except for r in LinLog and s in both Prl2 and LinLog, which were uniform on [0; 2] to avoid using degenerate priors. The bounds are plausible given that the largest reported estimates of r and s that we can find in the literature are r = 1:59 (Birnbaum and Chavez, 1997), and s = 1:40 (Stott, 2006).
The parameter v is assumed to be a function of the three fixed outcome values, x1, x2, and x3, which are set by the experimenter. By setting v = 0.5 in the simulation, we are assuming that the outcome values were set such that . In an actual experiment, the experimenter would need to set x1, x2 and x3 without foreknowledge of a participant's value function.
The flat-lining of the posterior probabilities in the HILO simulation may be related to the fact that the error rates on each trial were assumed to be iid. If a different form of stochastic error were assumed, in which the error rate on a given choice pair is tied to the utilities of the gambles in that pair (e.g., a ”white noise” model), then repeating the same stimuli would help to estimate the error rates more precisely, which in turn would provide information about the utility values. However, implementing this formally would require additional assumptions about the functional form of the white noise (e.g., logit or probit transformation), as well as additional computation for estimating and updating the error parameters.
Jefferys gave rule-of-thumb guidelines for interpreting Bayes factors: 1 to 3.2 is “not worth more than a bare mention,” 3.2 to 10 is “substantial,” 10 to 100 is “strong,” and greater than 100 is decisive. These cutoffs can be converted to posterior probabilities by transforming the odds ratio into a probability, as . For example, a Bayes factor of 100 is equivalent to a posterior probability of .
Posterior probabilities were also computed with the inclusion of a “null” model, in which choices are assumed to be made at random (e.g., choices are made based on the flip of a coin: A for heads, B for tails). Inclusion of the null model as a candidate only affected the final posterior probability for one participant (15), for whom the posterior probability of the null model was 0.47. This could be the result of the participant misunderstanding the instructions, failing to paying attention to the stimuli, choosing randomly, or somehow otherwise malingering.
Interestingly, for participants 9 and 13 the best fitting model was not the model with the highest posterior probability. This is because the posterior probability takes into account model complexity as well as model fit (Myung, 2000). For 9 and 13, the relative simplicity of the EU functional form outweighed the superior fit of the more complex competitors.
References
- Abdellaoui M, Bleichrodt H, Kammoun H. Do financial professionals behave according to prospect theory? an experimental study. Theory and Decision. 2011:1–19. [Google Scholar]
- Aczél J, Luce R. A behavioral condition for Prelec's weighting function on the positive line without assuming w(1) = 1. Journal of Mathematical Psychology. 2007;51(2):126–129. [Google Scholar]
- Akaike H. In Second international symposium on information theory. Vol. 1. Springer Verlag; 1973. Information theory and an extension of the maximum likelihood principle. pp. 267–281. [Google Scholar]
- Al-Nowaihi A, Dhami S. A simple derivation of Prelec's probability weighting function. Journal of Mathematical Psychology. 2006;50(6):521–524. [Google Scholar]
- Allais M. Le comportement de l'homme rationnel devant le risque: Critique des postulats et axiomes de l'école Américaine. Econometrica: Journal of the Econometric Society. 1953;21(4):503–546. [Google Scholar]
- Baucells M, Heukamp F. Probability and time tradeoff. Theory and Decision. 2009 [Google Scholar]
- Birnbaum M. New paradoxes of risky decision making. Psychological Review. 2008;115(2):463–500. doi: 10.1037/0033-295X.115.2.463. [DOI] [PubMed] [Google Scholar]
- Birnbaum M. A statistical test of independence in choice data with small samples. Judgment and Decision Making. 2012;7(1):97–109. [Google Scholar]
- Birnbaum M, Chavez A. Tests of theories of decision making: Violations of branch independence and distribution independence. Organizational Behavior and Human Decision Processes. 1997;71(2):161–194. [Google Scholar]
- Birnbaum M, Gutierrez R. Testing for intransitivity of preferences predicted by a lexicographic semi-order. Organizational Behavior and Human Decision Processes. 2007;104(1):96–112. [Google Scholar]
- Blavatskyy PR. Stochastic expected utility. Journal of Risk and Uncertainty. 2007;34:259–286. [Google Scholar]
- Bleichrodt H, Pinto J, Wakker P. Making descriptive use of prospect theory to improve the prescriptive use of expected utility. Management Science. 2001:1498–1514. [Google Scholar]
- Booij A, Van de Kuilen G. A parameter-free analysis of the utility of money for the general population under prospect theory. Journal of Economic Psychology. 2009;30(4):651–666. [Google Scholar]
- Burns Z, Chiu A, Wu G. Overweighting of small probabilities. Wiley Encyclopedia of Operations Research and Management Science. 2010 [Google Scholar]
- Camerer C. Advances in behavioral economics. Princeton University Press; 2004a. [Google Scholar]
- Camerer C. Camerer Colin F., Loewenstein George, Rabin Matthew., editors. Prospect theory in the wild: Evidence from the field. Advances in Behavioral Economics. 2004b:148–161. [Google Scholar]
- Camerer C, Ho T. Violations of the betweenness axiom and nonlinearity in probability. Journal of Risk and Uncertainty. 1994;8(2):167–196. [Google Scholar]
- Cavagnaro D, Gonzalez R, Myung J, Pitt M. Optimal decision stimuli for risky choice experiments: An adaptive approach. Management Science. 2013;25(2):358–375. doi: 10.1287/mnsc.1120.1558. [DOI] [PMC free article] [PubMed] [Google Scholar]
- Cavagnaro D, Myung J, Pitt M, Kujala J. Adaptive design optimization: A mutual information-based approach to model discrimination in cognitive science. Neural computation. 2010;22(4):887–905. doi: 10.1162/neco.2009.02-09-959. [DOI] [PubMed] [Google Scholar]
- Cavagnaro D, Pitt M, Myung J. Model discrimination through adaptive experimentation. Psychonomic bulletin & review. 2011;18(1):204–210. doi: 10.3758/s13423-010-0030-4. [DOI] [PMC free article] [PubMed] [Google Scholar]
- Chaloner K, Verdinelli I. Bayesian experimental design: A review. Statistical Science. 1995;10(3):273–304. [Google Scholar]
- Chew S, Waller W. Empirical tests of weighted utility theory. Journal of Mathematical Psychology. 1986;30(1):55–72. [Google Scholar]
- Conte A, Hey J, Moffatt P. Mixture models of choice under risk. Journal of Econometrics. 2011;162(1):79–88. [Google Scholar]
- Daniels R, Keller L. An experimental evaluation of the descriptive validity of lottery-dependent utility theory. Journal of Risk and uncertainty. 1990;3(2):115–134. [Google Scholar]
- Daniels R, Keller L. Choice-based assessment of utility functions. Organizational Behavior and Human Decision Processes. 1992;52(3):524–543. [Google Scholar]
- Diecidue E, Schmidt U, Zank H. Parametric weighting functions. Journal of Economic Theory. 2009;144(3):1102–1118. [Google Scholar]
- Donkers B, Melenberg B, Van Soest A. Estimating risk attitudes using lotteries: A large sample approach. Journal of Risk and Uncertainty. 2001;22(2):165–195. [Google Scholar]
- Epper T, Fehr-Duda H, Bruhin A. Viewing the future through a warped lens: Why uncertainty generates hyperbolic discounting. Journal of Risk and Uncertainty. 2011:1–35. [Google Scholar]
- Furlong E, Opfer J. Cognitive constraints on how economic rewards affect cooperation. Psychological Science. 2009;20(1):11–16. doi: 10.1111/j.1467-9280.2008.02244.x. [DOI] [PubMed] [Google Scholar]
- Gelman A, Carlin JB, Stern HS, Rubin DB. Bayesian Data Analysis. 2nd edition Chapman & Hall/CRC; Boca Raton, Florida: 2004. [Google Scholar]
- Goeree J, Holt C, Palfrey T. Quantal response equilibrium and overbidding in private-value auctions. Journal of Economic Theory. 2002;104(1):247–272. [Google Scholar]
- Goldstein W, Einhorn H. Expression theory and the preference reversal phenomena. Psychological Review. 1987;94(2):236. [Google Scholar]
- Gonzalez R, Wu G. On the shape of the probability weighting function. Cognitive psychology. 1999;38(1):129–166. doi: 10.1006/cogp.1998.0710. [DOI] [PubMed] [Google Scholar]
- Grinblatt M, Han B. Prospect theory, mental accounting, and momentum. Journal of nancial economics. 2005;78(2):311–339. [Google Scholar]
- Gurevich G, Kliger D, Levy O. Decision-making under uncertainty-a field study of cumulative prospect theory. Journal of Banking & Finance. 2009;33(7):1221–1229. [Google Scholar]
- Guthrie C. Empirical legal realism: A new social scientific assessment of law and human behavior: Prospect theory, risk preference, and the law. Northwestern University Law Review. 2003;97:1115–1891. [Google Scholar]
- Hey J. Why we should not be silent about noise. Experimental Economics. 2005;8(4):325–345. [Google Scholar]
- Holmes R, Jr, Bromiley P, Devers C, Holcomb T, McGuire J. Management theory applications of prospect theory: Accomplishments, challenges, and opportunities. Journal of Management. 2011;37(4):1069–1107. [Google Scholar]
- Ingersoll J. Non-monotonicity of the Tversky-Kahneman probability-weighting function: A cautionary note. European Financial Management. 2008;14(3):385–390. [Google Scholar]
- Jeffreys H. Theory of probability/by Harold Jeffreys. International series of monographs on physics. 1961 [Google Scholar]
- Jullien B, Salanié B. Estimating preferences under risk: The case of racetrack bettors. Journal of Political Economy. 2000;108(3):503–530. [Google Scholar]
- Kahneman D, Tversky A. Prospect theory: An analysis of decision under risk. Econometrica. 1979;47:263–291. [Google Scholar]
- Karmarkar U. Subjectively weighted utility: A descriptive extension of the expected utility model. Organizational Behavior and Human Performance. 1978;21(1):61–72. [Google Scholar]
- Karmarkar U. Subjectively weighted utility and the Allais paradox. Organizational Behavior and Human Performance. 1979;24(1):67–72. [Google Scholar]
- Kass R, Raftery A. Bayes factors. Journal of the american statistical association. 1995:773–795. [Google Scholar]
- Kusev P, van Schaik P, Ayton P, Dent J, Chater N. Exaggerated risk: Prospect theory and probability weighting in risky choice. Journal of Experimental Psychology: Learning, Memory, and Cognition. 2009;35(6):1487. doi: 10.1037/a0017039. [DOI] [PubMed] [Google Scholar]
- Lattimore P, Baker J, Witte A. Technical report. National Bureau of Economic Research; 1992. The influence of probability on risky choice: A parametric examination. [Google Scholar]
- Levy J. Applications of prospect theory to political science. Synthese. 2003;135(2):215–241. [Google Scholar]
- Liu C, Aitkin M. Bayes factors: Prior sensitivity and model generalizability. Journal of Mathematical Psychology. 2008;52(6):362–375. [Google Scholar]
- Liu Y. Technical report. Rutgers University; 1998. Prospect theory: Developments and applications in marketing. Working Paper. [Google Scholar]
- Luce R. Reduction invariance and Prelec's weighting functions. Journal of Mathematical Psychology. 2001;45(1):167–179. doi: 10.1006/jmps.1999.1301. [DOI] [PubMed] [Google Scholar]
- Luce R, Fishburn P. Rank-and sign-dependent linear utility models for finite first-order gambles. Journal of Risk and Uncertainty. 1991;4(1):29–59. [Google Scholar]
- Luce R, Mellers B, Chang S. Is choice the correct primitive? on using certainty equivalents and reference levels to predict choices among gambles. Journal of Risk and Uncertainty. 1993;6(2):115–143. [Google Scholar]
- Machina M. Expected utility theory without the independence axiom. Econometrica. 1982;50:277–323. [Google Scholar]
- Marschak J. Rational behavior, uncertain prospects, and measurable utility. Econometrica: Journal of the Econometric Society. 1950;18(2):111–141. [Google Scholar]
- Myung I. The importance of complexity in model selection. Journal of Mathematical Psychology. 2000;44(1):190–204. doi: 10.1006/jmps.1999.1283. [DOI] [PubMed] [Google Scholar]
- Nilsson H, Rieskamp J, Wagenmakers E. Hierarchical Bayesian parameter estimation for cumulative prospect theory. Journal of Mathematical Psychology. 2011;55(1):84–93. [Google Scholar]
- Prelec D. The probability weighting function. Econometrica. 1998:497–527. [Google Scholar]
- Shiffrin R, Lee M, Kim W, Wagenmakers E. A survey of model evaluation approaches with a tutorial on hierarchical Bayesian methods. Cognitive Science. 2008;32(8):1248–1284. doi: 10.1080/03640210802414826. [DOI] [PubMed] [Google Scholar]
- Stott H. Cumulative prospect theory's functional menagerie. Journal of Risk and Uncertainty. 2006;32(2):101–130. [Google Scholar]
- Tversky A, Fox C. Weighing risk and uncertainty. Psychological review. 1995;102(2):269. [Google Scholar]
- Tversky A, Kahneman D. Advances in prospect theory: Cumulative representation of uncertainty. Journal of Risk and uncertainty. 1992;5(4):297–323. [Google Scholar]
- Van de Kuilen G, Wakker P, Zou L. A midpoint technique for easily measuring prospect theory's probability weighting. Technical report. 2009 Working Paper. [Google Scholar]
- Wu G, Gonzalez R. Curvature of the probability weighting function. Management Science. 1996:1676–1690. [Google Scholar]
- Wu G, Gonzalez R. Common consequence conditions in decision making under risk. Journal of Risk and Uncertainty. 1998;16(1):115–139. [Google Scholar]
- Zeisberger S, Vrecko D, Langer T. Measuring the time stability of prospect theory preferences. Theory and Decision. 2011:1–28. [Google Scholar]
- Zhang H, Maloney L. Ubiquitous log odds: a common representation of probability and frequency distortion in perception, action, and cognition. Frontiers in Neuroscience. 2012;6 doi: 10.3389/fnins.2012.00001. [DOI] [PMC free article] [PubMed] [Google Scholar]


