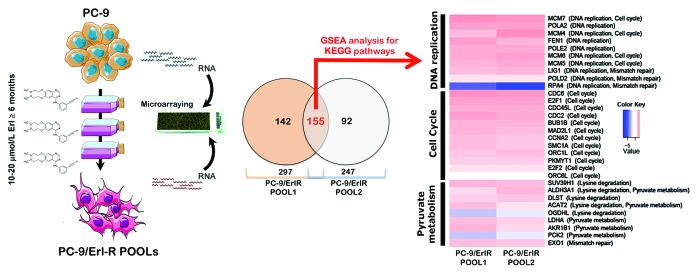
Figure 1. Pathway-based transcriptomic signature defining the erlotinib molecular function in EGFR-mutant NSCLC cells. Left. A schematic depicting the experimental approach designed to establish erlotinib-refractory populations (pools) of EGFR-mutant PC-9 NSCLC cells. Middle. The Venn diagram shows the overlap of genes whose expression was significantly altered following the acquisition of resistance to erlotinib. RNA was extracted from PC-9/Erl-R POOL1, PC-9/Erl-R POOL2, and PC-9 parental cells cultured in the presence of 1 μmol/L erlotinib. The RNA was then hybridized to G4112F Agilent Human Whole Genome Microarrays, and gene expression was analyzed as described in the “Materials and Methods” section. For the complete gene data, see Table 1. Right: The evolution of predictive biomarkers for erlotinib resistance in EGFR-mutant NSCLC cells was monitored using a pathway-based association analysis of genome-wide screening data as described in the “Materials and Methods” section. The heat map shows the clustered list of genes according to significant functions detected by GSEA with KEGG pathways. (1) DNA replication/mismatch repair; (2) Cell cycle; (3) Lysine degradation/pyruvate metabolism. The expression values are represented as colors, where the range of colors (red, pink, light blue, and dark blue) indicates the range of expression values (high, moderate, low, and lowest, respectively). Erl, erlotinib.

An official website of the United States government
Here's how you know
Official websites use .gov
A
.gov website belongs to an official
government organization in the United States.
Secure .gov websites use HTTPS
A lock (
) or https:// means you've safely
connected to the .gov website. Share sensitive
information only on official, secure websites.
