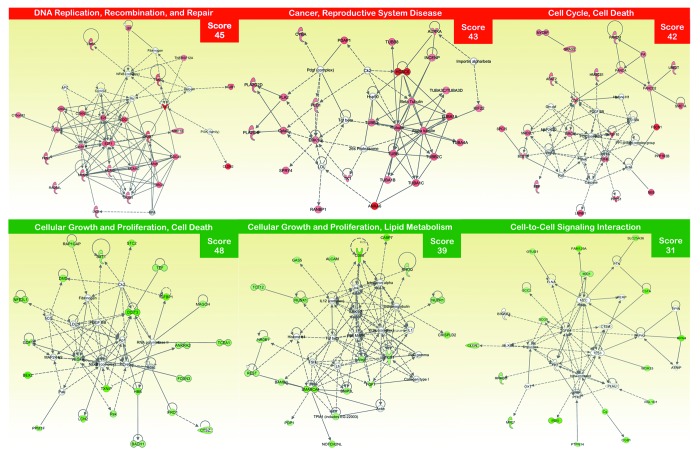
Figure 2. Network analysis of differentially expressed genes in EGFR-mutant PC-9 NSCLC cells that have acquired resistance to erlotinib. A data set containing the differentially expressed genes in response to erlotinib treatment (called the focus molecules, n = 155) between erlotinib-responsive PC-9 parental cells and erlotinib-refractory PC-9/Erl-R pools was overlaid onto a global molecular network developed from information contained in the Ingenuity Pathway (IPA) Knowledge Base. Networks of these focus molecules were then algorithmically generated based on their connectivity. The figure shows up- and downregulated networks (upper and bottom panels, respectively) with the three highest IPA scores (a composite measure that indicates the statistical significance of the interconnection between the molecules depicted in the network). The focus molecules are colored according to the gene expression (fold change) value; red gene symbols indicate upregulation, and green gene symbols indicate downregulation. The nodes are displayed using various shapes that represent the functional class of the gene product. Edges with dashed lines indicate indirect interactions, while continuous lines represent direct interactions.

An official website of the United States government
Here's how you know
Official websites use .gov
A
.gov website belongs to an official
government organization in the United States.
Secure .gov websites use HTTPS
A lock (
) or https:// means you've safely
connected to the .gov website. Share sensitive
information only on official, secure websites.
