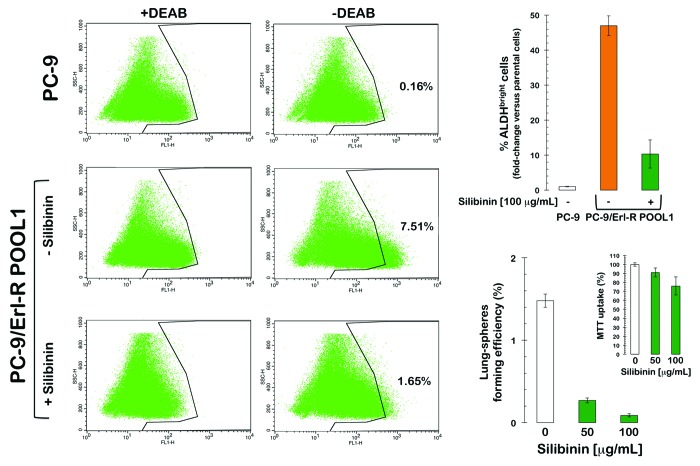
Figure 3. ALDH-expressing CSC-like cells in EGFR-mutant PC-9 NSCLC cells that have acquired resistance to erlotinib. Left: Erlotinib-naïve PC-9 parental cells and erlotinib-refractory PC-9/Erl-R cells were subjected to the ALDEFLUOR® assay to identify cells with high ALDH activity (ALDHbright) in the absence or presence of silibinin. The ALDH inhibitor DEAB was used as a negative control. The cells without inhibitor shifted to the right and were considered ALDHbright cells. Top right: The figure shows the fold change in the extension of the ALDHbright subpopulation calculated by dividing the number of ALDHbright cells in erlotinib-resistant PC-9/Erl-R cells (grown in the absence or presence of silibinin) by those in untreated PC-9 parental cells. Bottom right: TSFE of erlotinib-refractory PC-9/Erl-R cells in the absence or presence of increasing concentrations of silibinin was calculated as the number of spheres formed within 7 d divided by the original number of cells seeded. The results are expressed as percentages of the means (columns) ± SD (bars) (n = 2). Re-feeding of sphere cultures with silibinin and/or sphere medium was performed on days 3 and 5. The metabolic status of erlotinib-refractory PC-9/Erl-R cells treated with increasing concentrations of silibinin was measured using MTT uptake assays, and cell viability is expressed as % uptake relative to untreated control cells ( = 100% cell viability). The results are presented as the mean (columns) ± SD (bars) of 2 independent experiments performed in triplicate.

An official website of the United States government
Here's how you know
Official websites use .gov
A
.gov website belongs to an official
government organization in the United States.
Secure .gov websites use HTTPS
A lock (
) or https:// means you've safely
connected to the .gov website. Share sensitive
information only on official, secure websites.
