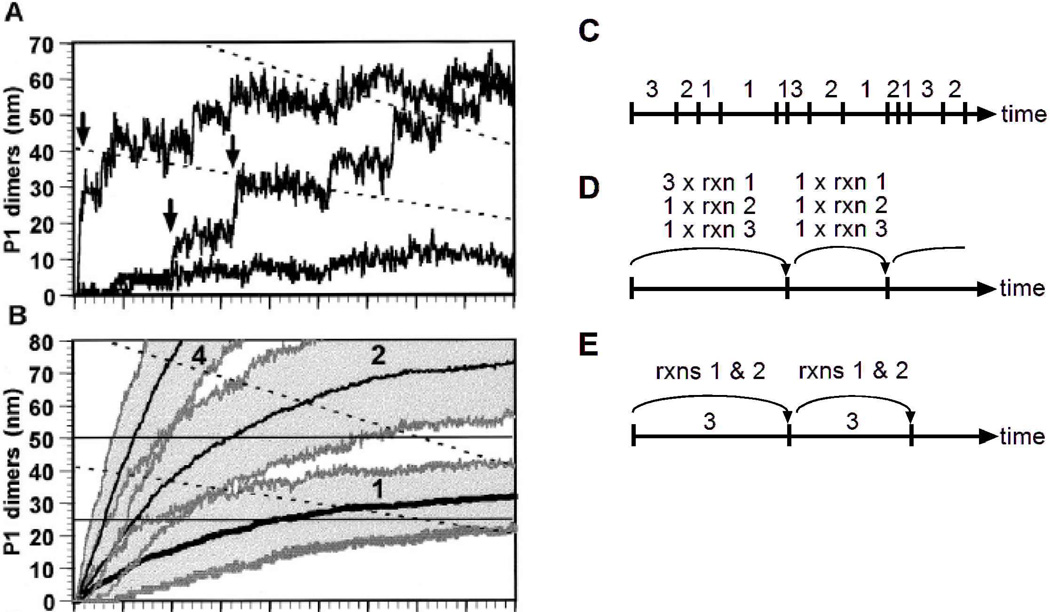
Figure 2. Schematic showing the Gillespie algorithm and its variations.
Panels A and B show examples of the Gillespie algorithm applied to the λ phage system, as described in the text (reprinted with permission from [44], copyright 1997 National Academy of Sciences, U.S.A.). Panels C-E, show schematics of different implementations of the Gillespie algorithm. In this schematic, the chemical system is composed of 3 different reactions. In each diagram, the axis represents time, tick marks represent iterations of the algorithm, and the labels represent the reaction(s) that occur during each iteration. Panel C illustrates the direct method in which one reaction (rxn) occurs per iteration. Panel D illustrates the tau-leaping method, in which multiple instances of multiple reactions may occur per iteration. Panel E illustrates a hybrid method, in which one instance of the slow reaction (reaction 3) occurs per iteration, while the other reactions are updated by some other technique. In each method, the period of time corresponding to each iteration is chosen stochastically, with tau-leaping and hybrid methods using generally larger time steps than the direct method.

