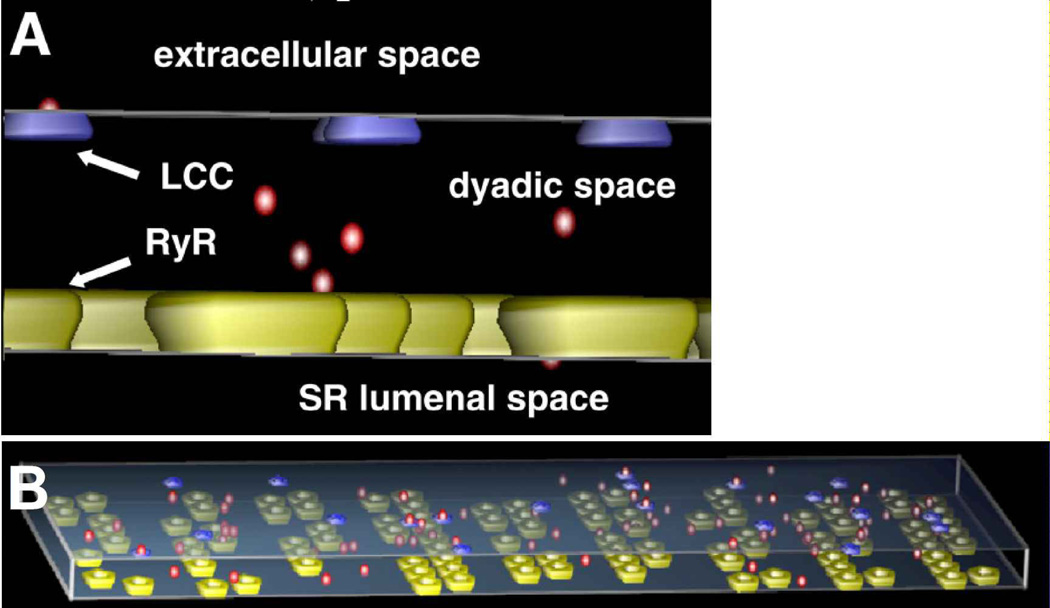
Figure 4. Example of spatial stochastic modeling.
Panel A shows a schematic of an M-Cell model used to model cardiac myocyte dyadic clefts (the narrow space between the cell membrane and sarcoplasmic reticulum). Calcium ions are shown in red, L-type calcium channels in blue, and ryanodine receptors in yellow. Panel B shows an example of an M-Cell simulation showing calcium signaling in the dyadic cleft. M-Cell tracks the location, random movement, and identity of each molecule within the system volume, thereby providing a spatial stochastic simulation. (Reprinted with permission from Fig. 1 of Reference [122]).

