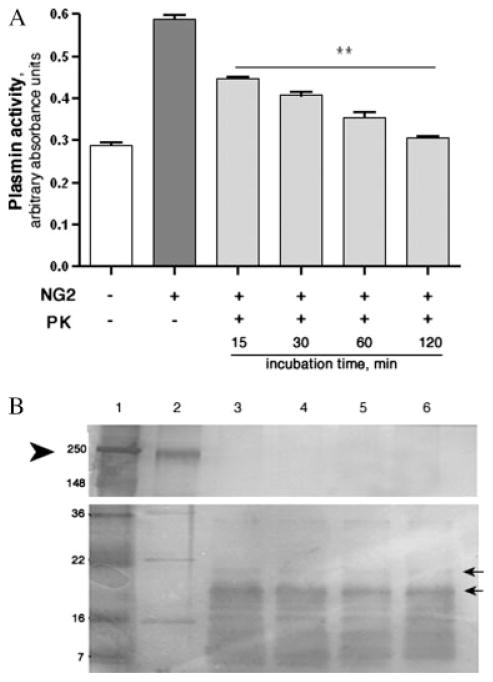
Fig. 4.
Degradation of the NG2 core protein results in loss of plasmin generation. PK was incubated with NG2 for different amounts of time. (A) A tPA-catalyzed plasmin generation assay was subsequently used to measure plasmin activity. The control reactions [tPA/plg alone (+NG2, −PK), and NG2 core protein (−NG2, −PK)] were allowed to proceed for 120 min. (B) silver staining was used to analyze NG2 breakdown products after PK digestion: lane 1: ladder, lane 2: non-treated NG2, lanes 3–6: 15, 30, 60, and 120 min of PK treatment, respectively. Arrowhead points to full-length NG2 (lane 2) and arrows point to some of the detectable degradation products (lanes 3–6). Molecular weight standards are also indicated. Error bars represent S.E.M where **P < 0.001 by ANOVA followed by Bonferroni’s post hoc test.

