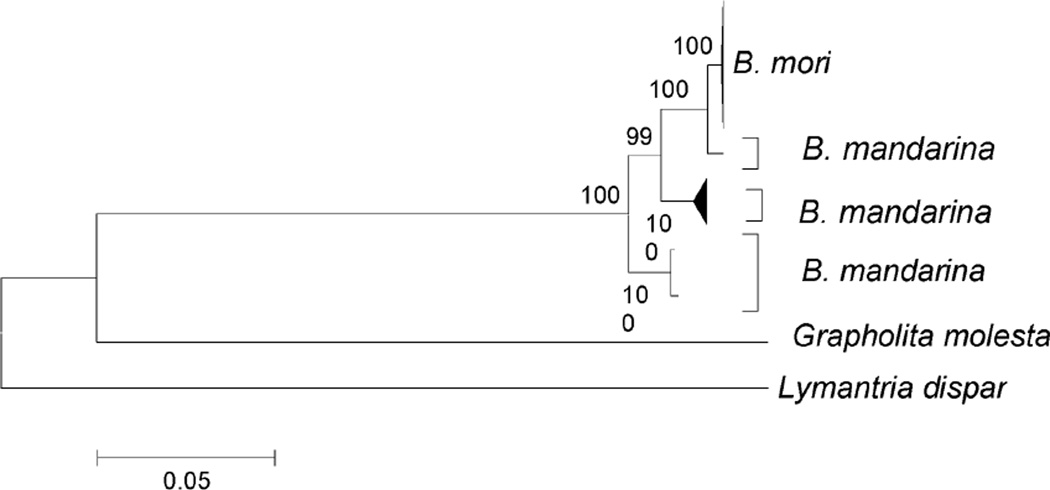
Figure 2.
Schematic illustration of ML tree of Bombyx mori and B. mandarina mt genomes (for full tree and sequences used see Supplementary Figure S4). Numbers on branches represent the percentage of 1000 bootstrap samples supporting the branch; only values ≥ 50% are shown.

