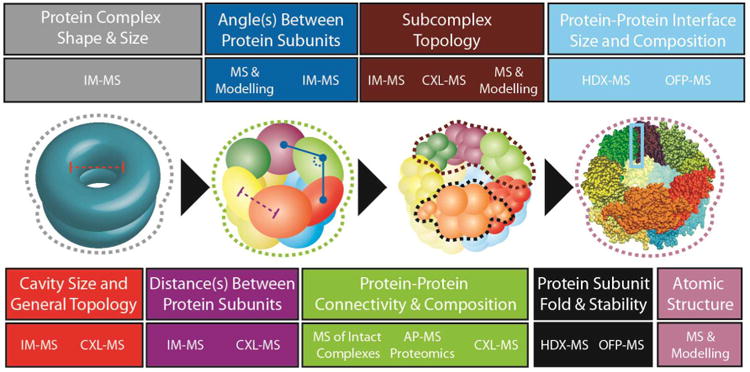
Figure 1.

There are multiple levels of protein structure accessible through mass spectrometry-based technologies. The center section of this figure depicts the same complex at various resolution levels, progressing toward a high-resolution structure, in order to illustrate some of the structural elements accessible by mass spectrometry. The top and bottom sections of the figure are color-coded to correspond with the highlighted structural elements indicated on each structural representation shown, and they also list the specific MS technologies capable of providing the information specified. This information includes complex shape (grey), cavity size (red), distance between protein subunits (purple), inter-subunit angles (blue), protein connectivity (green) monomer topology (black), subcomplex topology (maroon), protein-protein interface structure (light blue) and atomic-level structural detail (mauve). The techniques associated with each level of structural information are indicated by abbreviations that are defined in the text.
