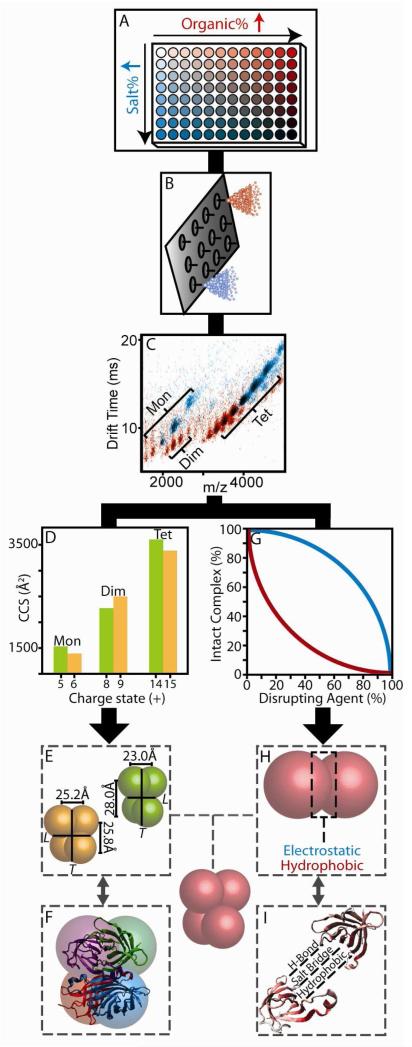
Figure 1.
IM-MS data collection and analysis procedures. (A) Disrupting agents and protein complexes are mixed in solvents containing either increased amounts of organic (DMSO, red) or salt (NH4Ac, blue). (B) Each sample is sprayed using a chip based nESI emitter array. (C) An example overlay of two IM-MS plots under high organic (red) and high salt (blue) conditions. (D) IM based size measurements recovered for both intact complexes and subcomplexes as a function of charge state (E & F). Protein sizes are converted to distance constraints, and tested against those calculated from X-ray. (G) Signal intensities recorded for intact complex ions are plotted against the amount of disrupting agent added in solution. (H & I) These data are analyzed with respect to the separate interaction types found within the protein-protein interfaces from X-ray.

