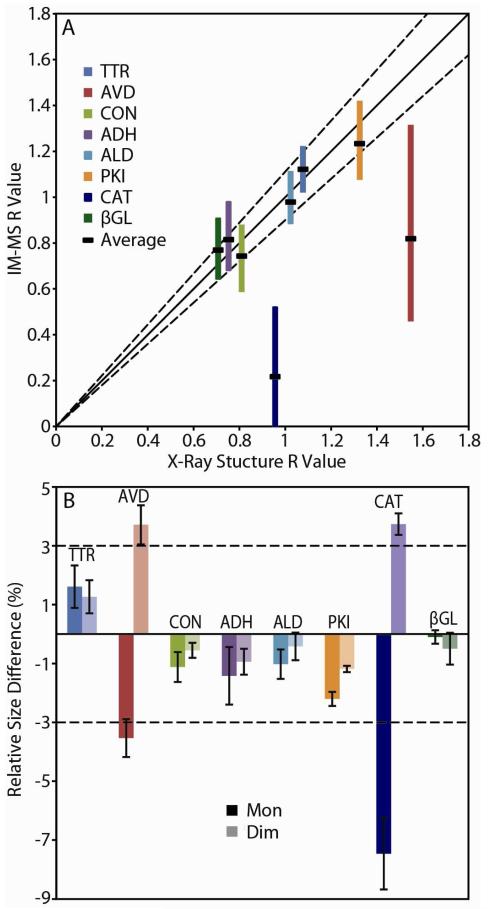
Figure 2.
(A) A plot of R values generated from IM-MS data vs. R values from X-ray structures for eight protein tetramers. Color-coded bands indicate the range of R values recovered from IM-MS data, and black bands represent the average. The solid line represents a 1:1 correlation between the IM-MS experiment and X-ray, with the dashed lines representing a 90% confidence interval. (B) Relative size differences observed between IM-MS and X-ray data for monomers (dark colors) and dimers (light colors) released during disruption. Dashed lines indicate the ±3% error for IM-MS CCS determinations.

