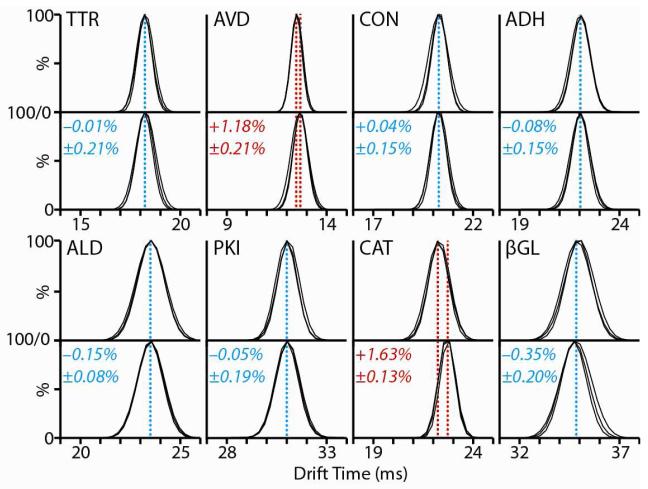
Figure 3.
Comparison between the IM distributions and centroids recorded for intact tetramer ions generated under control (200mM NH4Ac, upper panel) and disruption conditions (lower panel). Three replicates are measured and overlaid for each dataset shown. Blue dashed lines indicate those datasets where no significant shift in tetramer drift time is observed (<1%). Red dashed lines indicate those cases where a drift time shift (≥1%) is observed under disrupting solution conditions when compared to control.

