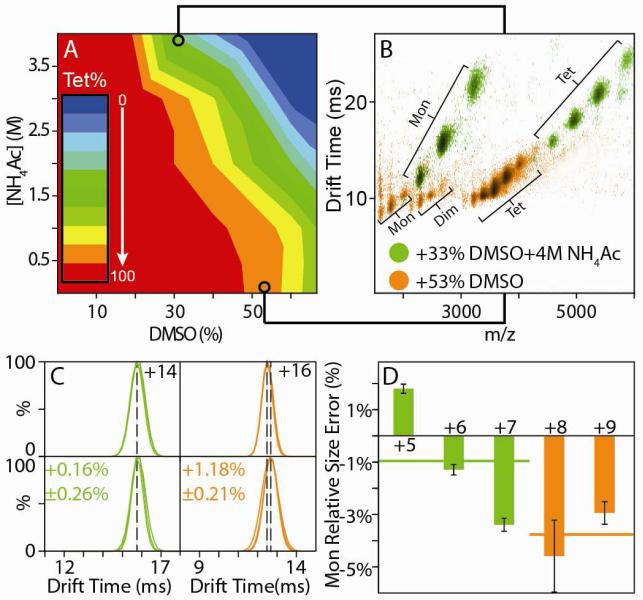
Figure 4.
AVD topology models from IM-MS data are brought into close agreement with X-ray when disruption conditions incorporating high ionic strength are used. (A) 2D titration results for AVD using DMSO and NH4Ac as disrupting agents. (B) Overlay of two IM-MS contour plots extracted from the dataset shown in A (green and orange). (C) A comparison of the drift time distributions recorded for the remaining intact tetramer ions formed from the two disruption conditions (lower panels) with those measured under control conditions (200 mM NH4Ac, upper panels). (D) The relative errors in monomer size measured by IM when compared to X-ray data for different AVD monomer charge states derived from the disruption conditions defined in C. Solid lines indicate the average monomer size for each solution condition.

