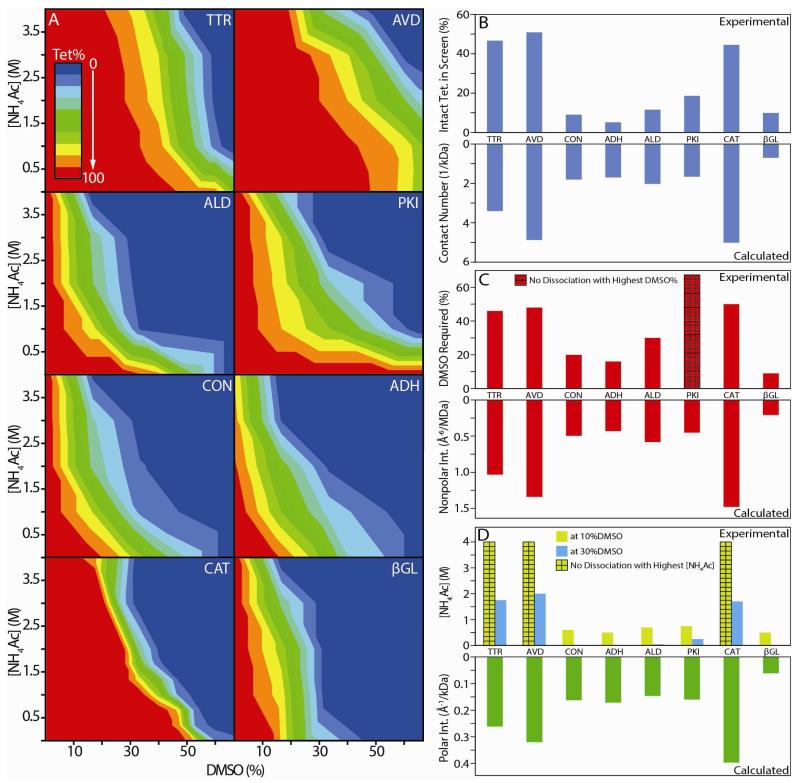
Figure 5.
(A) 2D titration results obtained for the eight homo-tetrameric protein complexes studied here, where NH4Ac concentration (M) is plotted against DMSO solution content (%). The colors shown indicate the normalized intensity of the tetramer ion signal recorded under each solution condition, from red (100%) to blue (0%). Correlations between our IM-MS titration experiments (top) and X-ray structure data (bottom) are presented in three histogram plots (B), (C) and (D). (B) Normalized intact tetramer intensity integrated over all disruption conditions vs. the number of contacts per unit kDa calculated from X-ray data. (C) The DMSO % in solution, without added NH4Ac, required to initiate tetramer disruption (signal drops by 10%) vs. the estimated average strength of hydrophobic contacts within the protein-protein contacts from X-ray (Å−6/MDa). (D) NH4Ac concentration required for tetramer disruption at fixed 10% (yellow) and 30% DMSO (blue) vs. the estimated average strength of the polar interactions (Å−1/kDa) within the protein-protein contacts from X-ray. For all datasets, bars marked with a grid pattern indicate that the complex did not undergo disruption using any amount of the selected agent under the conditions of the screen. Linear correlation coefficients between IM-MS and X-ray datasets are discussed in the text.

