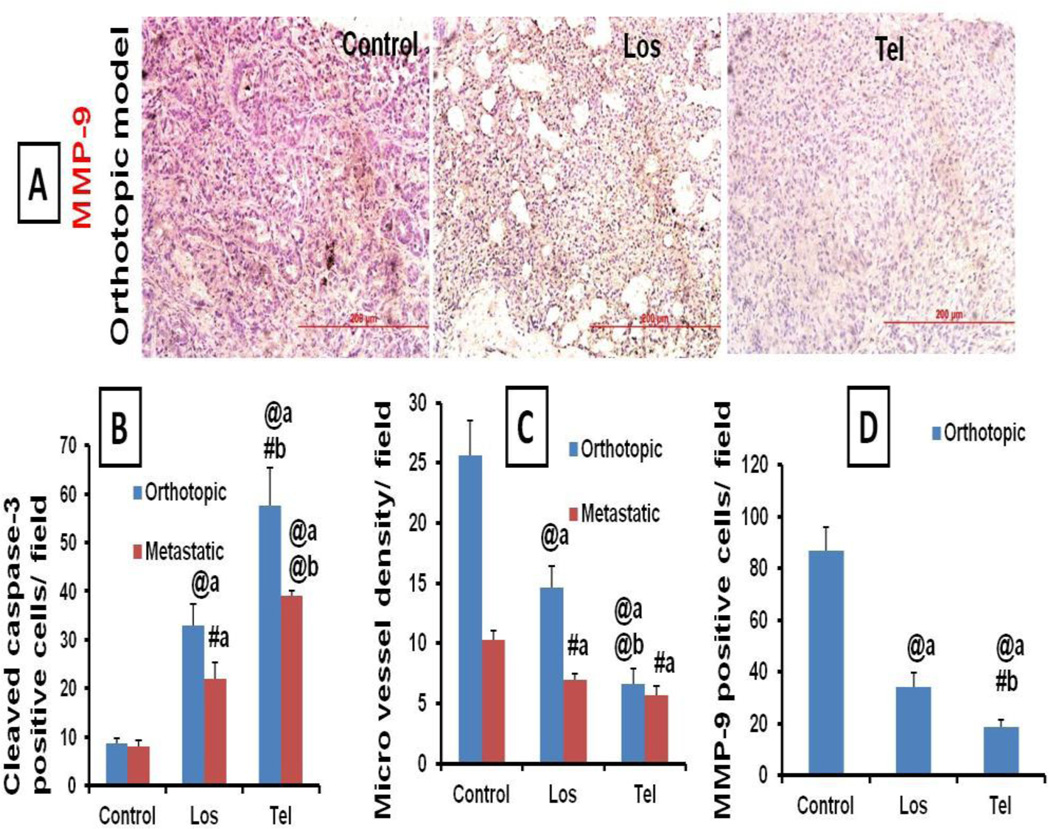
Figure 8.
Immunohistochemical analysis of tumor sections: (A) Representative microscopic images of Immunohistochemical analysis of MMP-9 in orthotopic tumor model treated with Los and Tel. Vast number of MMP-9 positive cells (Brown colored) was observed in untreated control tumors. Quantitative IHC analysis of (B) Cleaved caspase 3, (C) MVD and (D) MMP-9 expressions in various groups after treatment with Los and Tel. The averages of 10 fields per slide, 3 slides from each group were studied for the IHC analysis. Each data point was represented as mean ± sem (n=3). #P<0.01 and @P<0.001 a Vs control and b Vs Los group.

