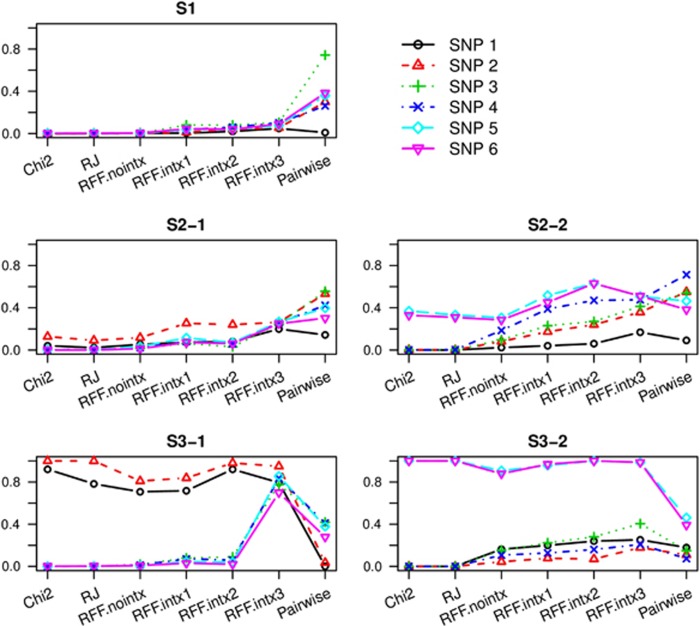
Figure 1.
Power for detecting each risk SNPs using 500 cases and 500 controls. The power to detect the six risk SNPs are shown for the five scenarios. ‘Chi2' represent χ2 tests; ‘RJ' for Random Jungle test; ‘Pairwise' for pairwise SNP–SNP interaction test by PLINK fast-epitasis. In all tests, we declared the top 31 SNPs as ‘detected' to estimate the power. ‘RFF.nointx' and ‘RFF.intx' are RFF tests without and with guidance by interactions. ‘RFF.intx1' and ‘RFF.intx2' used empirical guidance based on the pairwise interaction tests, with SNP coverage of 4 and 24, respectively; and ‘RFF.intx3' used theoretical guidance based on synthetic interactions clustered over the six risk SNPs.

