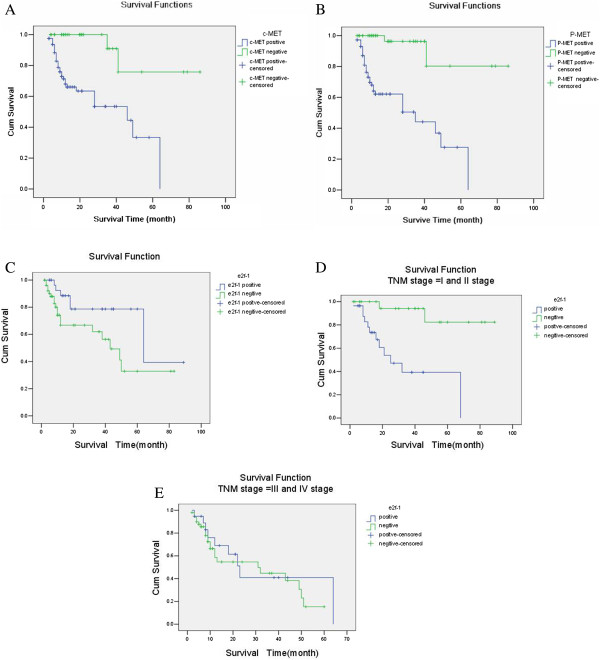
Figure 2.
Postoperative long-term survival curves regarding to the expression of c-MET, p-MET and e2f-1. Notes: A: Grouped by c-MET expression (P = 0.001); B; Grouped by p-MET expression (P = 0.001). C: Grouped by e2f-1 expression (P = 0.036). D: In patients with stages I and II grouped by e2f-1 positive and negative expression; E: In patients with stages III and IV grouped by e2f-1 positive and negative expression.

