Figure 1.

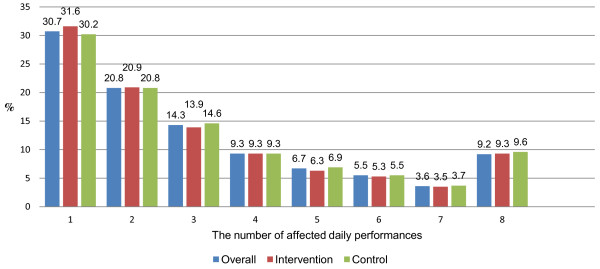
Weighted percentage distribution of the extent of impacts (number of OIDP performances affected by oral conditions) among individuals with impacts in the intervention and control group (n = 1971).

Weighted percentage distribution of the extent of impacts (number of OIDP performances affected by oral conditions) among individuals with impacts in the intervention and control group (n = 1971).