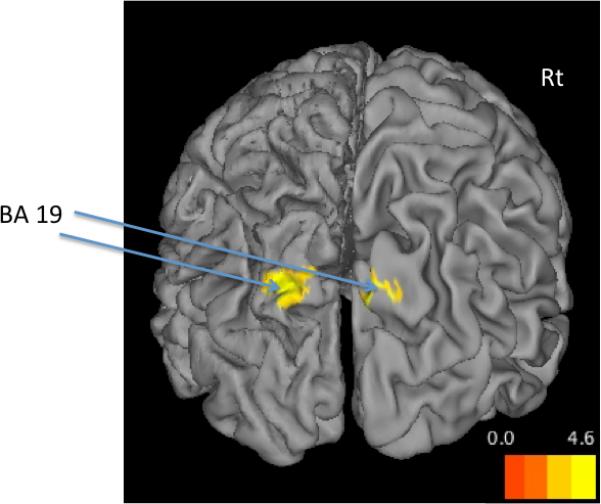
Figure 2. Patient>Control DMN Activity.

Statistical map set at a family-wise error corrected cluster-level threshold of p < 0.05 and overlaid on 3-D SPM template using CARET. The figure shows the back view of the surface (Rt=Right); BA: Brodmann Area. Patients showed more activity than controls in the cuneus region (BA19).
