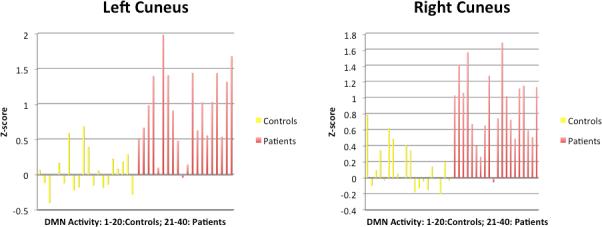
Figure 4. Individual DMN Activity z-scores for Patient>Control.

Activity (z-scores) in regions where patients show greater DMN activity than controls. The yellow bars represent DMN activity in controls and the red bars represent DMN activity in patients.
