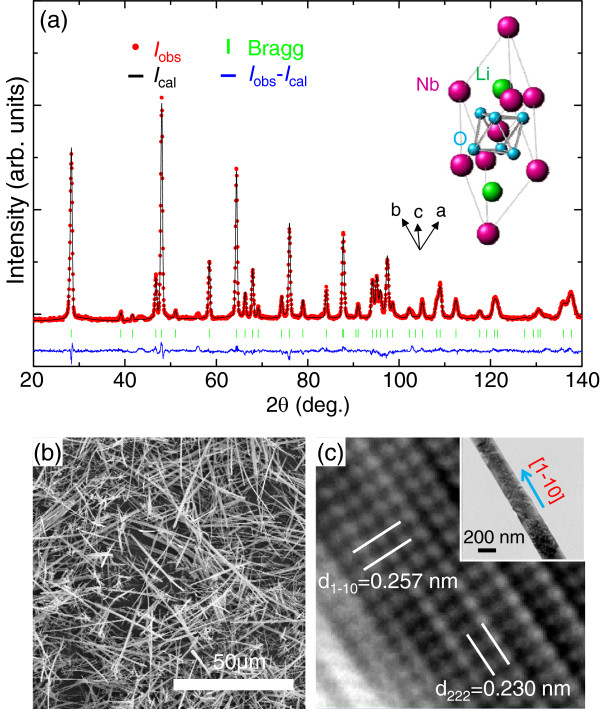
Figure 2.
Structural characterization of LiNbO3. (a) Rietveld analysis of neutron diffraction patterns of LiNbO3. The red dots represent the observed intensity. The black lines represent the calculated intensity. The blue line corresponds to the difference between the observed and calculated intensities. The green line shows the Bragg reflection. In the inset of (a), we show the crystal structure of LiNbO3. (b) Field-emission scanning electron microscopy (FE-SEM) and (c) high-resolution transmission electron microscopy (HR-TEM) images of LiNbO3. In the inset of (c), we show a medium-resolution TEM image of a LiNbO3 nanowire.

