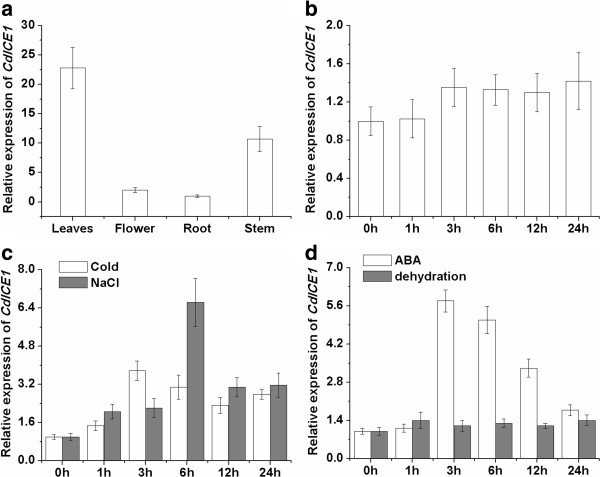
Figure 1.
Quantitative reverse transcription PCR (qRT-PCR) analysis of CdICE1 expression in C. dichrum plants. (a)CdICE1 expression of different organs under non-stress conditions; (b) CdICE1 expression of leaves at different times under non-stress conditions; (c–d) CdICE1 expression of leaves under abiotic stress. Means and standard error calculated from triplicate assays.

