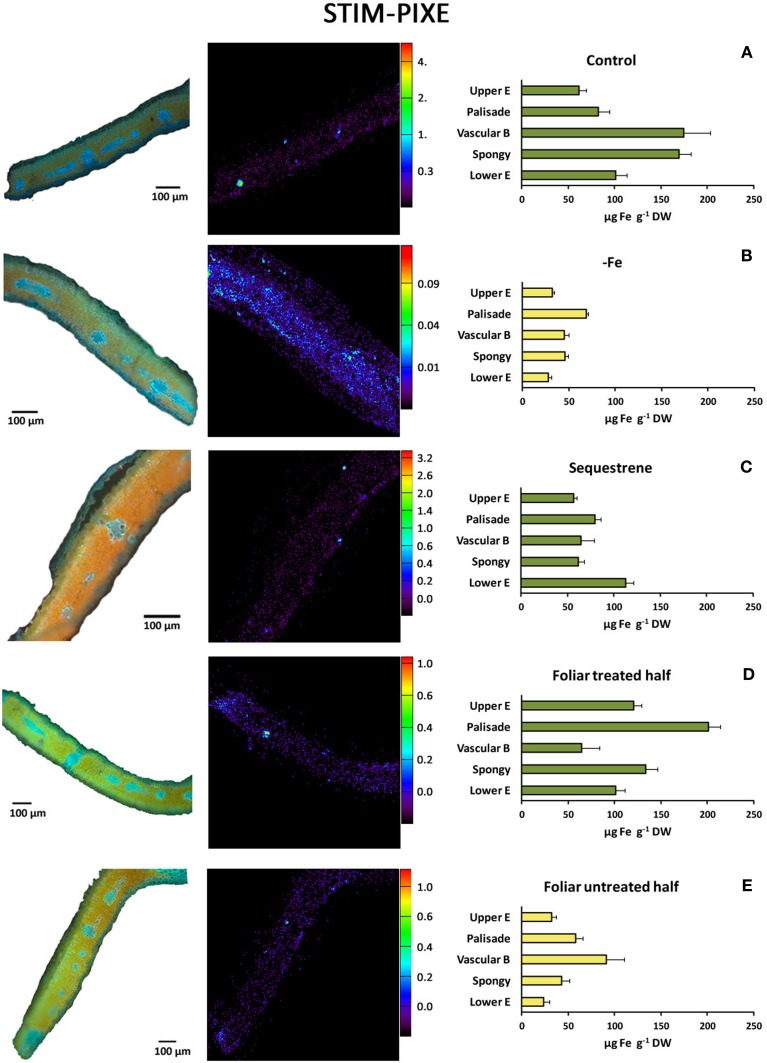
Figure 7.
STIM μ-PIXE mapping and quantitative analysis of Fe (right panels) of selected areas from transversal sections of peach tree leaves. (A) Fe-sufficient control; (B) Fe-deficient chlorotic; (C) soil Fe-fertilized (Fe(III)-EDDHA -Sequestrene-, 50 g per tree); (D) distal Fe-treated leaf part (2 mM FeSO4 with 0.1% surfactant); and (E) basal untreated leaf part in the same leaves used for (D). Signals are means in μg Fe g−1 DW (± SE).

