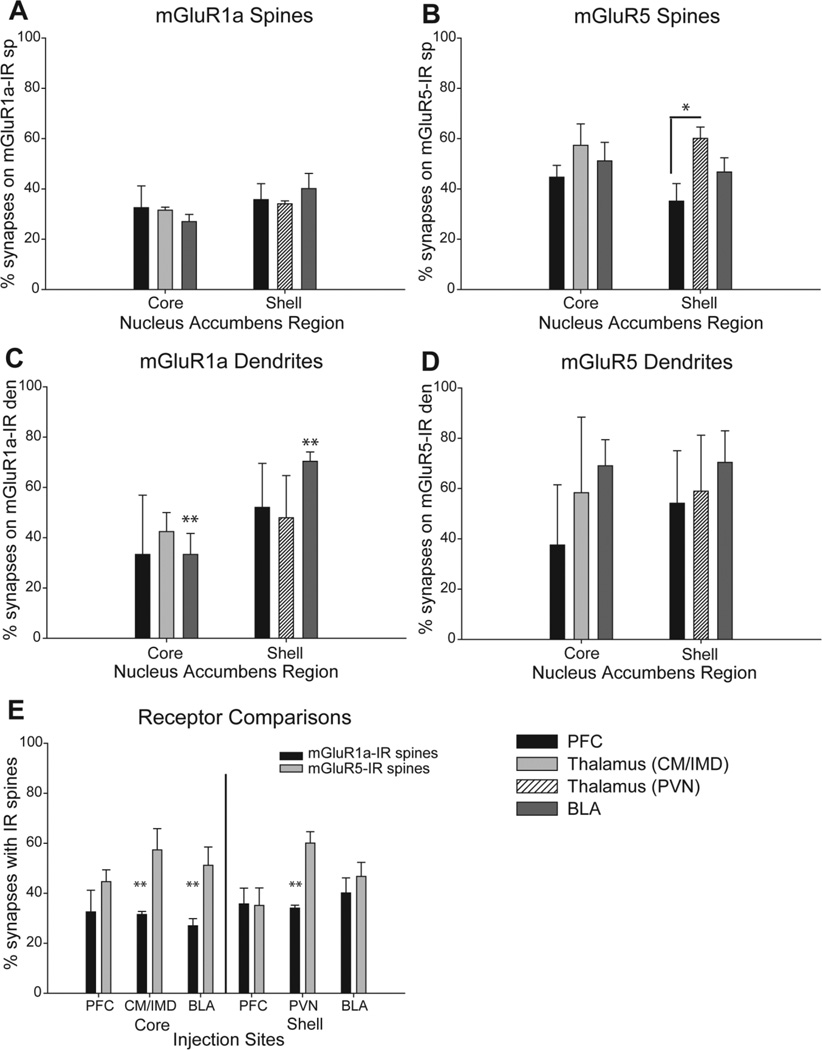
Figure 3.
Histograms showing the percentage of labeled terminals in contact with mGluR1a- or mGluR5-IR spines and dendrites in the accumbens. The legend in the lower right corner applies to A-D. A,B: Summary of the mean percentage ( + SEM) of labeled terminals from the cerebral cortex, the basolateral amygdala, or the different thalamic nuclei in contact with mGluR1a–IR (A) or mGluR5-IR (B) spines in the core and shell of the nucleus accumbens. The total numbers of animals used and terminals examined in each of these experiments are: PFC injections: n = 4 animals; 122 terminals in the core, 87 in the shell of mGluR1a–labeled tissue; 94 terminals in the core, 85 in the shell of the mGluR5-labeled tissue. PVN injections: n = 4 animals; 97 terminals in the mGluR1a–labeled tissue, 104 in the mGluR5-labeled tissue. CM/IMD injections: n = 3 animals; 79 terminals in the mGluR1a–labeled tissue, 54 in the mGluR5-labeled tissue). BLA injections: n = 3 animals; 87 terminals in the core, 51 in the shell of mGluR1a–labeled tissue; 83 terminals in the core, 80 in the shell of mGluR5-labeled tissue). In B, the single asterisk indicates a significantly higher percentage of positive terminals from the PVN than the PFC in contact with mGluR5-IR spines in the shell of the accumbens (F2, 10 = 4.9, P< 0.05). C,D: The percent of labeled terminals in contact with mGluR1a–IR (C) or mGluR5-IR (D) dendrites in the core and shell of the accumbens. The total number of animals used from each group was the same as for the axospinous synapses, whereas the total number of terminals examined was as follows: from the PFC: 5 in the core, 18 in the shell of mGluR1a–labeled tissue; 4 in the core, 9 in the shell of mGluR5-labeled tissue; from the PVN: 11 in mGluR1a–labeled tissue, 17 in mGluR5-immunostained tissue; from the CM/IMD: 17 in mGluR1a–labeled tissue, 6 in mGluR5-labeled tissue; and from the BLA: 12 in the core, 24 in the shell of mGluR1a–labeled tissue; 20 in the core, 23 in the shell of mGluR5-immunostained tissue. The double asterisks indicate a significant difference between the percent of mGluR1a–IR dendrites contacted by the BLA in the shell compared with the core (C, t = 4.1, P < 0.05). E: Comparison of the relative percentages of mGluR1a- and mGluR5-IR spines contacted by the different glutamatergic afferents to the core and shell of the nucleus accumbens. The double asterisks indicate a significantly lower percentage of terminals from the CM/IMD (t = 3.0, P < 0.05), BLA (t = 3.1, P < 0.05), and PVN (t = 5.5, P = 0.001) in contact with mGluR1a–IR spines compared with mGluR5-IR spines in the accumbens core and shell, respectively.

