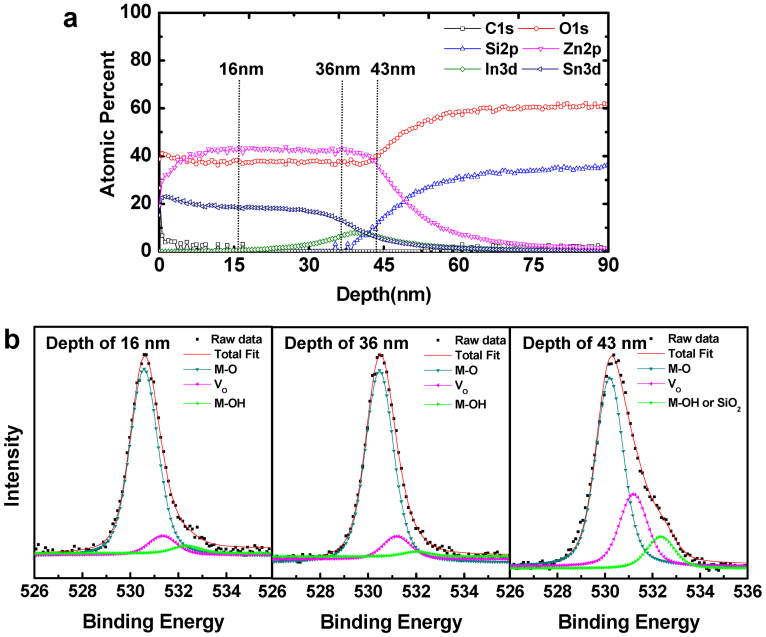
Figure 5. Composition analysis of the ZTO/IZO device.
(a) Depth profile of the elements in the ZTO/IZO(8.3 nm)/SiO2 stack structure. (b) O1s XP spectra of the position at a depth of 16, 36, and 43 nm, which correspond to the bulk ZTO region, near-interfacial ZTO/IZO region, and interfacial IZO/SiO2 region, respectively. The O1s spectra were de-convoluted into three different peaks, the “lattice oxygen peak without oxygen vacancies” (530.4 eV), the “lattice oxygen peak in the oxygen deficient region” (531.2 eV), and the “metal hydroxide peak or SiO2–related peak” (531.3 eV).

