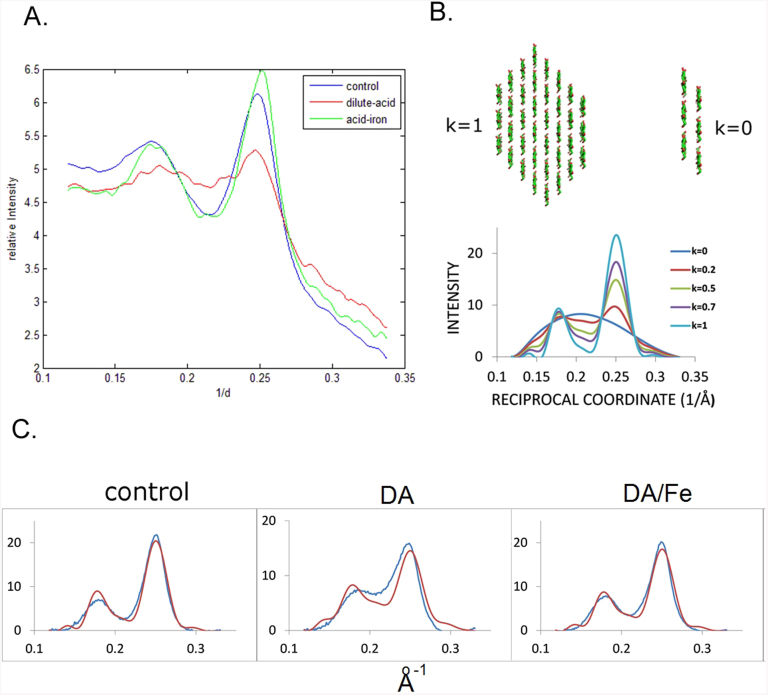
Figure 3.
Modeling the equatorial data: (A) Equatorial traces from WAXS patterns of untreated; DA- and DA/Fe-pretreated samples. (B) Equatorial scattering predicted from mixtures of 36-chain fibrils and 2-layer fragments (C) Comparison of background subtracted intensity (blue) with that predicted (red) for scattering from mixtures of 36 chain fibrils and two-layer aggregates. Additional details of the data analysis are included in the SI and Figures S6, S7 and S8.

